Exam 10: Pure Competition in the Short Run
Exam 1: Limits, Alternatives, and Choices107 Questions
Exam 2: The Market System and the Circular Flow287 Questions
Exam 3: Demand, Supply, and Market Equilibrium151 Questions
Exam 4: Market Failures Caused by Externalities Asymmetric Information229 Questions
Exam 5: Public Goods, Public Choice, and Government Failure268 Questions
Exam 6: Elasticity399 Questions
Exam 7: Utility Maximization358 Questions
Exam 8: Behavioral Economics311 Questions
Exam 9: Businesses and the Costs of Production445 Questions
Exam 10: Pure Competition in the Short Run342 Questions
Exam 11: Pure Competition in the Long Run250 Questions
Exam 12: Pure Monopoly407 Questions
Exam 13: Monopolistic Competition279 Questions
Exam 14: Oligopoly and Strategic Behavior362 Questions
Exam 15: Technology, RD, and Efficiency309 Questions
Exam 16: The Demand for Resources359 Questions
Exam 17: Wage Determination168 Questions
Exam 18: Rent, Interest, and Profit305 Questions
Exam 19: Natural Resource and Energy Economics337 Questions
Exam 20: Public Finance: Expenditures and Taxes336 Questions
Exam 21: Antitrust Policy and Regulation264 Questions
Exam 22: Agriculture: Economics and Policy265 Questions
Exam 23: Income Inequality, Poverty, and Discrimination324 Questions
Exam 24: Health Care280 Questions
Exam 25: Immigration259 Questions
Exam 26: International Trade347 Questions
Exam 27: The Balance of Payments, Exchange Rates, and Trade Deficits318 Questions
Exam 28: The Economics of Developing Countries277 Questions
Select questions type
 The accompanying table gives cost data for a firm that is selling in a purely competitive market. The marginal cost of the fifth unit of output is
(Multiple Choice)
4.8/5  (36)
(36)
 Which point in the accompanying graph is the shutdown point for the firm?
(Multiple Choice)
4.9/5 (42)
T-Shirt Enterprises is selling in a purely competitive market. It is producing 3,000 units, selling them for $2.00 each. At this level of output, the average total cost is 2.50 and the average variable cost is $2.20. Based on these data, the firm should
(Multiple Choice)
4.8/5 (31)
Assume for a competitive firm that MC = AVC at $12, MC = ATC at $20, and MC = MR at $16. This firm will
(Multiple Choice)
4.9/5 (40)
A purely competitive seller should produce (rather than shut down)in the short run
(Multiple Choice)
4.9/5 (42)
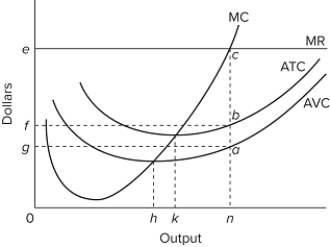 In the provided diagram, the short-run supply curve for this firm is the
(Multiple Choice)
4.8/5 (26)
 The accompanying table gives cost data for a firm that is selling in a purely competitive market. If product price is $25, the firm will
(Multiple Choice)
4.7/5 (27)
The Campus Crustacean Company receives $2 per box for its crawfish and is selling 1,600 boxes to maximize its profits. What is the profit per box of crawfish at this equilibrium level of output if the average variable cost is $1 per box and total fixed costs are $1,200?
(Multiple Choice)
4.9/5 (43)
 The table shows the total costs for a purely competitive firm. If the product sells for $1,200 a unit, the firm's profit-maximizing output is
(Multiple Choice)
4.9/5 (43)
 The accompanying table gives cost data for a firm that is selling in a purely competitive market. We can infer that, at zero output, this firm's total fixed, total variable, and total costs are
(Multiple Choice)
4.8/5 (36)
Which of the following is characteristic of a purely competitive seller's demand curve?
(Multiple Choice)
4.9/5 (39)
 The accompanying table applies to a purely competitive industry composed of 100 identical firms. For each of the 100 firms in this industry, marginal revenue and total revenue will be
(Multiple Choice)
4.8/5 (42)
If a firm is confronted with economic losses in the short run, it will decide whether or not to produce by comparing
(Multiple Choice)
4.8/5 (40)
 The first table shows cost data for a single firm. Now suppose that there are 600 identical firms in this industry, each with the same cost data. Suppose, too, that the demand curve for this industry is as shown in the second table.
  At equilibrium, each firm will realize
(Multiple Choice)
4.8/5 (36)
Farmer Jones is producing wheat and must accept the market price of $6.00 per bushel. At this time, her average total costs and her marginal costs both equal $5.00 per bushel. Her minimum average variable costs are $3.50 per bushel. In order to maximize profits or minimize losses in the short run, farmer Jones should
(Multiple Choice)
5.0/5 (41)
In the short run, fixed costs for a profitable competitive firm are
(Multiple Choice)
4.9/5 (28)
 The accompanying table gives cost data for a firm that is selling in a purely competitive market. At 5 units of output, average fixed cost, average variable cost, and average total cost are
(Multiple Choice)
4.8/5 (36)
The principle that a firm should produce up to the point where the marginal revenue from the sale of an extra unit of output is equal to the marginal cost of producing it is known as the
(Multiple Choice)
4.9/5 (34)
Explain the marginal revenue and marginal cost approach to profit maximization, and use it to describe profit, loss, and shut-down situations for the purely competitive firm.
(Essay)
4.8/5 (33)
 The first table shows cost data for a firm that is selling in a purely competitive market. Now assume there are 100 identical firms in this industry, each of which has the same cost data as the single firm described in the cost table. Now consider the demand curve data for this industry as shown in the second table.
  The equilibrium price in the market will be
(Multiple Choice)
4.9/5 (35)
Filters
- Essay(0)
- Multiple Choice(0)
- Short Answer(0)
- True False(0)
- Matching(0)