Exam 10: Pure Competition in the Short Run
Exam 1: Limits, Alternatives, and Choices107 Questions
Exam 2: The Market System and the Circular Flow287 Questions
Exam 3: Demand, Supply, and Market Equilibrium151 Questions
Exam 4: Market Failures Caused by Externalities Asymmetric Information229 Questions
Exam 5: Public Goods, Public Choice, and Government Failure268 Questions
Exam 6: Elasticity399 Questions
Exam 7: Utility Maximization358 Questions
Exam 8: Behavioral Economics311 Questions
Exam 9: Businesses and the Costs of Production445 Questions
Exam 10: Pure Competition in the Short Run342 Questions
Exam 11: Pure Competition in the Long Run250 Questions
Exam 12: Pure Monopoly407 Questions
Exam 13: Monopolistic Competition279 Questions
Exam 14: Oligopoly and Strategic Behavior362 Questions
Exam 15: Technology, RD, and Efficiency309 Questions
Exam 16: The Demand for Resources359 Questions
Exam 17: Wage Determination168 Questions
Exam 18: Rent, Interest, and Profit305 Questions
Exam 19: Natural Resource and Energy Economics337 Questions
Exam 20: Public Finance: Expenditures and Taxes336 Questions
Exam 21: Antitrust Policy and Regulation264 Questions
Exam 22: Agriculture: Economics and Policy265 Questions
Exam 23: Income Inequality, Poverty, and Discrimination324 Questions
Exam 24: Health Care280 Questions
Exam 25: Immigration259 Questions
Exam 26: International Trade347 Questions
Exam 27: The Balance of Payments, Exchange Rates, and Trade Deficits318 Questions
Exam 28: The Economics of Developing Countries277 Questions
Select questions type
 The table gives data for a purely competitive firm. When the firm produces 3 units of output, it makes an economic
(Multiple Choice)
4.9/5  (41)
(41)
Why does price equal marginal revenue for the purely competitive firm? What is the relationship to the demand curve for the firm?
(Essay)
4.9/5 (40)
 According to the information in the provided diagram, this firm is selling its product in a(n)
(Multiple Choice)
4.9/5 (47)
 The data in the accompanying table indicates that this firm is selling its output in a(n)
(Multiple Choice)
4.9/5 (45)
A purely competitive firm currently producing 30 units of output earns marginal revenues of $12 from each extra unit of output it sells. If it sells 30 units, then its total revenues would be
(Multiple Choice)
4.9/5 (36)
Assume that labor is a variable input. The average wage of workers increases in a purely competitive industry. This change will result in a(n)
(Multiple Choice)
4.9/5 (40)
An industry comprising 40 firms, none of which has more than 3 percent of the total market for a differentiated product, is an example of
(Multiple Choice)
4.8/5 (47)
 Refer to the accompanying cost table. If a competitive firm faced with these costs finds that it can sell its product at $60 per unit, it will
(Multiple Choice)
4.8/5 (37)
 The first table shows cost data for a single firm. Now suppose that there are 600 identical firms in this industry, each with the same cost data. Suppose, too, that the demand curve for this industry is as shown in the second table.
  When the market is in equilibrium, each of the firms will be producing
(Multiple Choice)
4.8/5 (35)
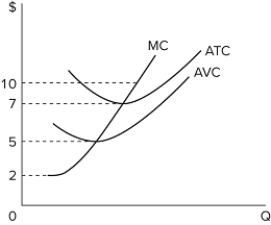
 Refer to the accompanying graph for a purely competitive firm operating at a loss in the short run. Which area in the graph represents the portion of total costs that the firm can recoup by continuing to produce rather than shutting down?
(Multiple Choice)
4.8/5 (36)
In answering the question, assume a graph in which dollars are measured on the vertical axis and output on the horizontal axis.For a purely competitive firm, total revenue graphs as a
(Multiple Choice)
4.8/5 (42)
A competitive firm in the short run can determine the profit-maximizing (or loss-minimizing)output by equating
(Multiple Choice)
4.9/5 (40)
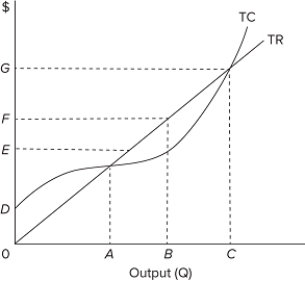 Refer to the provided graph for a purely competitive firm in the short run. If the firm increases its output level from B to C, then its total profits will be
(Multiple Choice)
4.7/5 (54)
The short-run supply curve slopes upward because producers must be compensated for rising marginal costs.
(True/False)
4.8/5 (47)
 The accompanying table shows cost data for a firm that is selling in a purely competitive market. If the market price for the firm's product is $60, the firm will
(Multiple Choice)
4.8/5 (26)
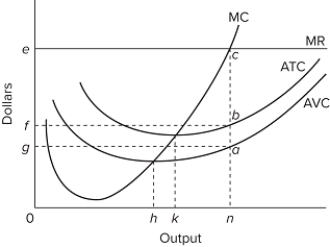
 This purely competitive firm shown in the accompanying graph will not produce unless price is at least
(Multiple Choice)
4.8/5 (39)
Suppose that Joe sells pork in a purely competitive market. The market price of pork is $3 per pound. Joe's marginal revenue from selling the 12th pound of pork would be
(Multiple Choice)
4.9/5 (31)
If the market demand for the product increases, in the short run a purely competitive firm
(Multiple Choice)
4.8/5 (39)
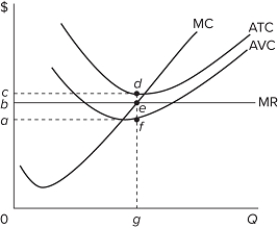
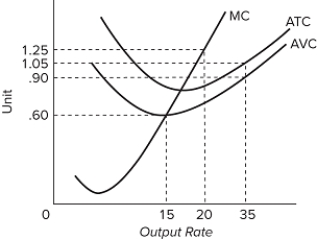 The accompanying graph shows the cost curves for a competitive firm. What is the lowest price at which the firm will start producing output in the short run?
(Multiple Choice)
4.9/5 (36)
Filters
- Essay(0)
- Multiple Choice(0)
- Short Answer(0)
- True False(0)
- Matching(0)