Exam 10: Aggregate Demand and Supply
Exam 1: Introducing the Economic Way of Thinking176 Questions
Exam 2: Production Possibilities, Opportunity Cost, and Economic Growth200 Questions
Exam 3: Market Demand and Supply348 Questions
Exam 4: Markets in Action261 Questions
Exam 5: Gross Domestic Product223 Questions
Exam 6: Business Cycles and Unemployment194 Questions
Exam 7: Inflation126 Questions
Exam 8: The Keynesian Model235 Questions
Exam 9: The Keynesian Model in Action202 Questions
Exam 10: Aggregate Demand and Supply187 Questions
Exam 11: Fiscal Policy223 Questions
Exam 12: The Public Sector127 Questions
Exam 13: Federal Deficits, Surpluses, and the National Debt99 Questions
Exam 14: Money and the Federal Reserve System154 Questions
Exam 15: Money Creation243 Questions
Exam 16: Monetary Policy213 Questions
Exam 17: The Phillips Curve and Expectations Theory120 Questions
Exam 18: International Trade and Finance248 Questions
Exam 19: Economies in Transition104 Questions
Exam 20: Growth and the Less-Developed Countries117 Questions
Exam 21: Applying Graphs to Economics68 Questions
Exam 22: Consumer Surplus, Producer Surplus, and Market Efficiency68 Questions
Exam 23: the Self-Correcting Aggregate Demand and Supply Model83 Questions
Exam 24: Policy Disputes Using the Self-Correcting Aggregate Demand and Supply Model36 Questions
Select questions type
The aggregate demand curve shows how real GDP purchased varies with changes in:
(Multiple Choice)
4.8/5  (44)
(44)
Which of the following characterizes the classical view of the economy?
(Multiple Choice)
4.9/5 (39)
Exhibit 10-1 Aggregate supply curve 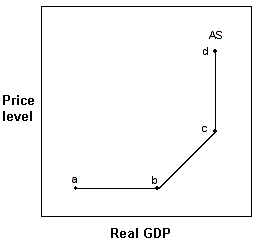 In Exhibit 10-1, resources are fully employed, and competition among producers for resources will lead to a higher price level in:
(Multiple Choice)
4.9/5 (36)
A change in which of the following would shift the aggregate demand curve?
(Multiple Choice)
4.9/5 (44)
Exhibit 10-4 Aggregate supply and demand curves 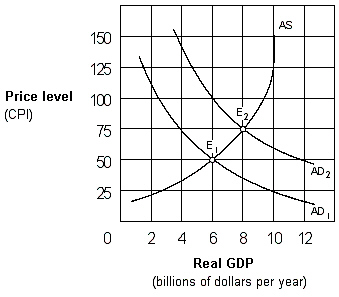 The increase in the price level as the economy moves from E1 to E2 in Exhibit 10-4 represents:
(Multiple Choice)
4.7/5 (40)
The pre-Keynesian or classical economic theory viewed the long-run aggregate supply curve for the economy to be:
(Multiple Choice)
4.8/5 (43)
The aggregate demand curve slopes downward indicating that:
(Multiple Choice)
4.9/5 (38)
In the aggregate demand\aggregate supply model, a country's full-employment real GDP is represented by:
(Multiple Choice)
4.9/5 (39)
Suppose workers become pessimistic about their future employment, which causes them to save more and spend less. If the economy is on the intermediate range of the aggregate supply curve, then:
(Multiple Choice)
4.8/5 (41)
Exhibit 10-3 Aggregate supply and demand curves 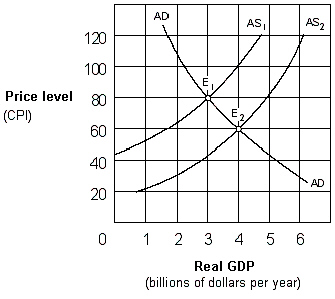 The shift from AS1 to AS2 in Exhibit 10-3 could be caused by a(n):
(Multiple Choice)
4.8/5 (44)
The interest-rate effect is the impact on real GDP caused by the inverse relationship between the price level and the interest rate.
(True/False)
5.0/5 (35)
According to the net exports effect, as the price level falls relative to the rest of the world,
(Multiple Choice)
4.8/5 (31)
When prices rise, consumers and businesses hold larger money balances. This reduces the supply of loanable funds, increases the interest rate, and discourages both consumption and investment. This process is called the:
(Multiple Choice)
4.8/5 (42)
According to classical theory, if the aggregate demand curve decreased and the economy experienced unemployment, then:
(Multiple Choice)
4.8/5 (36)
The net exports effect is the direct relationship between net exports and the price level of an economy.
(True/False)
4.8/5 (40)
Which of the following reasons helps explain why the aggregate demand curve is downward sloping?
(Multiple Choice)
4.9/5 (28)
The real balances effect occurs because a higher price level will reduce the real value of people's:
(Multiple Choice)
4.8/5 (44)
Filters
- Essay(0)
- Multiple Choice(0)
- Short Answer(0)
- True False(0)
- Matching(0)