Exam 10: Aggregate Demand and Supply
Exam 1: Introducing the Economic Way of Thinking176 Questions
Exam 2: Production Possibilities, Opportunity Cost, and Economic Growth200 Questions
Exam 3: Market Demand and Supply348 Questions
Exam 4: Markets in Action261 Questions
Exam 5: Gross Domestic Product223 Questions
Exam 6: Business Cycles and Unemployment194 Questions
Exam 7: Inflation126 Questions
Exam 8: The Keynesian Model235 Questions
Exam 9: The Keynesian Model in Action202 Questions
Exam 10: Aggregate Demand and Supply187 Questions
Exam 11: Fiscal Policy223 Questions
Exam 12: The Public Sector127 Questions
Exam 13: Federal Deficits, Surpluses, and the National Debt99 Questions
Exam 14: Money and the Federal Reserve System154 Questions
Exam 15: Money Creation243 Questions
Exam 16: Monetary Policy213 Questions
Exam 17: The Phillips Curve and Expectations Theory120 Questions
Exam 18: International Trade and Finance248 Questions
Exam 19: Economies in Transition104 Questions
Exam 20: Growth and the Less-Developed Countries117 Questions
Exam 21: Applying Graphs to Economics68 Questions
Exam 22: Consumer Surplus, Producer Surplus, and Market Efficiency68 Questions
Exam 23: the Self-Correcting Aggregate Demand and Supply Model83 Questions
Exam 24: Policy Disputes Using the Self-Correcting Aggregate Demand and Supply Model36 Questions
Select questions type
A decrease in aggregate supply can result in:
Free
(Multiple Choice)
4.9/5  (33)
(33)
Correct Answer: Verified
D
Which of the following correctly describes the interest-rate effect?
Free
(Multiple Choice)
4.8/5 (38)
Correct Answer:Verified
D
When price level in the United States rises,
Free
(Multiple Choice)
4.8/5 (41)
Correct Answer:Verified
C
Assuming prices and wages are fully flexible, the aggregate supply curve will be:
(Multiple Choice)
4.9/5 (40)
Which of the following is not a reason for the downward slope of the aggregate demand curve?
(Multiple Choice)
4.8/5 (33)
The vertical portion of the aggregate supply curve shows that at full employment an increase in the price level will:
(Multiple Choice)
4.8/5 (34)
The aggregate supply curve is vertical at the level of real GDP that corresponds to the natural rate of unemployment.
(True/False)
4.8/5 (33)
Cost-push inflation is caused by a leftward shift of the aggregate demand curve.
(True/False)
4.8/5 (45)
The total quantity of goods and services demanded by households, firms, foreigners, and government at varying price levels is:
(Multiple Choice)
4.8/5 (30)
Exhibit 10-7 Aggregate supply and demand curves 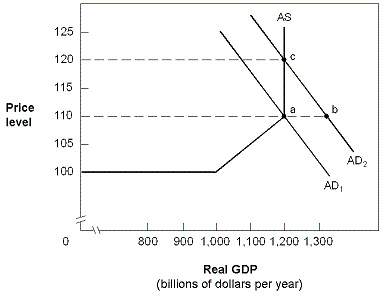 In Exhibit 10-7, the aggregate demand and supply curves reflect an economy in which:
(Multiple Choice)
4.9/5 (38)
The aggregate supply curve is horizontal in the intermediate range.
(True/False)
4.9/5 (43)
Exhibit 10-3 Aggregate supply and demand curves 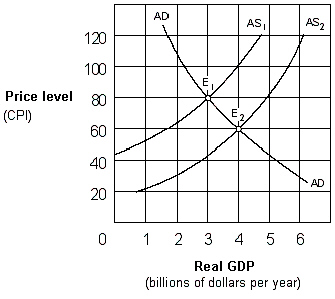 A shift in the aggregate supply curve in Exhibit 10-3 from AS1 to AS2 would be caused by a(n):
(Multiple Choice)
4.8/5 (41)
In the upward-sloping segment of the aggregate supply curve,
(Multiple Choice)
4.9/5 (38)
The Keynesian range of the aggregate supply curve applies when the economy is at or near full employment.
(True/False)
4.9/5 (32)
Other factors held constant, a decrease in resource prices will shift the aggregate:
(Multiple Choice)
4.9/5 (38)
When the economy is operating well below capacity, an increase in spending tends to be reflected primarily in a(n):
(Multiple Choice)
4.8/5 (34)
How are demand-pull and cost-push inflation reflected in terms of the AD-AS model?
(Essay)
4.7/5 (41)
Filters
- Essay(0)
- Multiple Choice(0)
- Short Answer(0)
- True False(0)
- Matching(0)