Exam 21: Applying Graphs to Economics
Exam 1: Introducing the Economic Way of Thinking176 Questions
Exam 2: Production Possibilities, Opportunity Cost, and Economic Growth200 Questions
Exam 3: Market Demand and Supply348 Questions
Exam 4: Markets in Action261 Questions
Exam 5: Gross Domestic Product223 Questions
Exam 6: Business Cycles and Unemployment194 Questions
Exam 7: Inflation126 Questions
Exam 8: The Keynesian Model235 Questions
Exam 9: The Keynesian Model in Action202 Questions
Exam 10: Aggregate Demand and Supply187 Questions
Exam 11: Fiscal Policy223 Questions
Exam 12: The Public Sector127 Questions
Exam 13: Federal Deficits, Surpluses, and the National Debt99 Questions
Exam 14: Money and the Federal Reserve System154 Questions
Exam 15: Money Creation243 Questions
Exam 16: Monetary Policy213 Questions
Exam 17: The Phillips Curve and Expectations Theory120 Questions
Exam 18: International Trade and Finance248 Questions
Exam 19: Economies in Transition104 Questions
Exam 20: Growth and the Less-Developed Countries117 Questions
Exam 21: Applying Graphs to Economics68 Questions
Exam 22: Consumer Surplus, Producer Surplus, and Market Efficiency68 Questions
Exam 23: the Self-Correcting Aggregate Demand and Supply Model83 Questions
Exam 24: Policy Disputes Using the Self-Correcting Aggregate Demand and Supply Model36 Questions
Select questions type
Exhibit 1A-6 Straight line  In Exhibit 1A-6, the slope of the straight line A-D is:
Free
(Multiple Choice)
4.9/5  (39)
(39)
Correct Answer: Verified
A
A horizontal line has an infinite slope.
Free
(True/False)
4.9/5 (36)
Correct Answer:Verified
False
Which of the following statements is correct?
Free
(Multiple Choice)
4.8/5 (31)
Correct Answer:Verified
E
In a graphic relationship, shifts in a curve are caused by a change in:
(Multiple Choice)
4.9/5 (32)
A straight line or curve can shift when a factor not included on the vertical axis or horizontal axis changes.
(True/False)
4.9/5 (30)
Exhibit 1A-3 Straight line 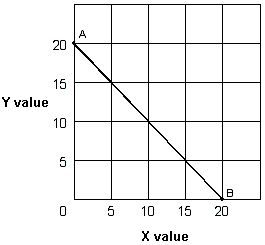 Straight line AB in Exhibit 1A-3 shows that:
(Multiple Choice)
4.8/5 (39)
Two variables that are inversely related tend to move in opposite directions.
(True/False)
4.9/5 (41)
Exhibit 1A-1 Straight line 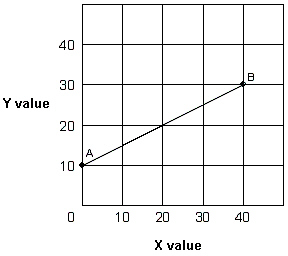 As shown in Exhibit 1A-1, the slope of straight line AB:
(Multiple Choice)
4.8/5 (39)
Which of the following pairs is the most likely to exhibit a direct relationship?
(Multiple Choice)
4.9/5 (40)
Exhibit 1A-6 Straight line 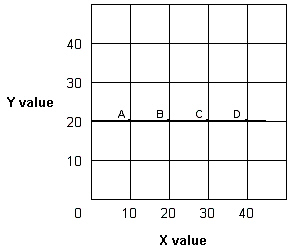 Straight line A-D in Exhibit 1A-6 shows that:
(Multiple Choice)
4.8/5 (30)
Exhibit 1A-4 Straight line 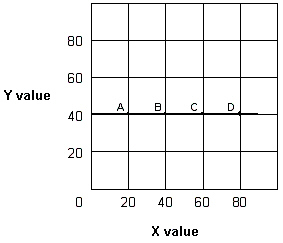 Straight line A-D in Exhibit 1A-4 shows that:
(Multiple Choice)
4.7/5 (28)
Exhibit 1A-6 Straight line  In Exhibit 1A-6, the slope of straight line A-D is:
(Multiple Choice)
4.8/5 (25)
Exhibit 1A-8 Straight line relationship 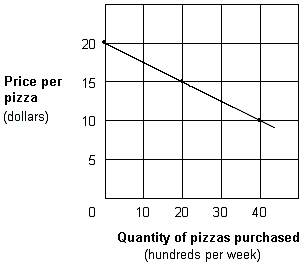 Which of the following would cause a shift in the relationship shown in Exhibit 1A-8?
(Multiple Choice)
4.9/5 (37)
Exhibit 1A-8 Straight line relationship  According to the Exhibit 1A-8, the relationship between the price and quantity purchased of pizza is:
(Multiple Choice)
4.9/5 (39)
A graph can be used to illustrate the relationship between the price of compact discs and the quantity of compact discs demanded. If there is evidence that buyers' income also influences the demand for compact discs, then a movement along the curve can be caused by a change in the price of compact discs.
(True/False)
4.9/5 (28)
Exhibit 1A-3 Straight line  In Exhibit 1A-3, the slope for straight line AB is:
(Multiple Choice)
4.8/5 (42)
Filters
- Essay(0)
- Multiple Choice(0)
- Short Answer(0)
- True False(0)
- Matching(0)