Exam 4: Supply and Demand: an Initial Look
Exam 1: What Is Economics261 Questions
Exam 2: The Economy: Myth and Reality185 Questions
Exam 3: The Fundamental Economic Problem: Scarcity and Choice290 Questions
Exam 4: Supply and Demand: an Initial Look337 Questions
Exam 21: An Introduction to Macroeconomics216 Questions
Exam 22: The Goals of Macroeconomic Policy212 Questions
Exam 23: Economic Growth: Theory and Policy228 Questions
Exam 24: Aggregate Demand and the Powerful Consumer219 Questions
Exam 25: Demand-Side Equilibrium: Unemployment or Inflation216 Questions
Exam 26: Bringing in the Supply Side: Unemployment and Inflation228 Questions
Exam 27: Managing Aggregate Demand: Fiscal Policy210 Questions
Exam 28: Money and the Banking System224 Questions
Exam 29: Monetary Policy: Conventional and Unconventional210 Questions
Exam 30: The Financial Crisis and the Great Recession66 Questions
Exam 31: The Debate Over Monetary and Fiscal Policy219 Questions
Exam 32: Budget Deficits in the Short and Long Run215 Questions
Exam 33: The Trade-Off Between Inflation and Unemployment219 Questions
Exam 34: International Trade and Comparative Advantage226 Questions
Exam 35: The International Monetary System: Order or Disorder218 Questions
Exam 36: Exchange Rates and the Macroeconomy219 Questions
Exam 37: Contemporary Issues in the Us Economy23 Questions
Select questions type
Black-market prices are below equilibrium prices because sellers want to sell large quantities.
(True/False)
4.9/5  (37)
(37)
If orange juice prices fall by 25 percent next year, there will be a
(Multiple Choice)
4.8/5 (42)
A strike at the Financial News in London shut down its production, and the sales of a competing newspaper, the Broad Street Journal, increased dramatically, with no increase in price. Based upon this, what can you say about the Broad Street Journal's supply curve?
(Multiple Choice)
4.9/5 (38)
A black market develops only when quantity demanded exceeds quantity supplied.
(True/False)
4.8/5 (37)
The change in the amount of a good purchased after a shift of the supply curve depends on
(Multiple Choice)
4.8/5 (40)
A shift of the demand curve for a good occurs whenever new technologies make inputs used in producing that good available at lower prices.
(True/False)
4.9/5 (50)
The price of coal fell and the quantity sold also fell. Everything else being equal, it is consistent that
(Multiple Choice)
4.9/5 (35)
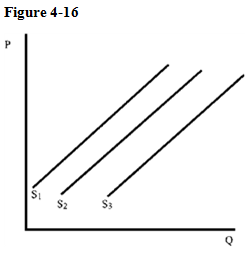 Assume that Figure 4-16 shows the supply of steak. An increase in the price of cattle feed will change the supply from
(Multiple Choice)
4.9/5 (36)
Equilibrium price and quantity are determined by the intersection of the demand and supply curves.
(True/False)
4.9/5 (35)
The supply curve of books (which are produced using paper made from trees) will shift to the left in response to
(Multiple Choice)
4.8/5 (38)
If price of a good rises, what happens to the demand for that good, all other things held constant?
(Multiple Choice)
4.8/5 (35)
Professional baseball teams in the United States use only wooden bats. If aluminum bats were permitted, the impact on the wooden bat market would be
(Multiple Choice)
4.9/5 (42)
The interest rate is the price borrowers pay to borrow money.Key interest rates are controlled by the Federal Reserve System.If the Federal Reserve acts to reduce interest rates, economists would expect the quantity of money demanded to
(Multiple Choice)
4.8/5 (44)
The demand for home computers has increased, yet the price has fallen. Explain this apparent paradox.
(Essay)
4.9/5 (42)
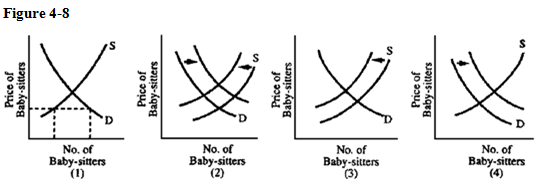 Families are having more children than families did 15 years earlier. As a result, families have more trouble finding baby-sitters and are shocked at the cost of child care. Which graph in Figure 4-8 best illustrates how the situation has changed?
(Multiple Choice)
4.8/5 (38)
Any change that shifts the supply curve outward to the right and does not affect the demand curve will lower the equilibrium price and raise the equilibrium.
(True/False)
4.9/5 (36)
"Equilibrium" is a situation in which there are no inherent forces to produce change.
(True/False)
4.8/5 (34)
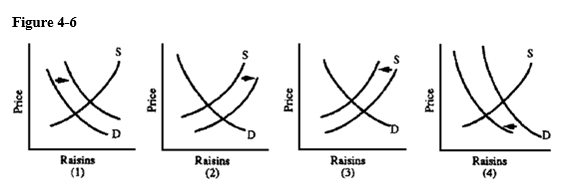 Grapes can be used to produce wine or raisins. Which graph in Figure 4-6 best depicts the effects on the U.S. raisin market of a decline in purchases of domestic wine?
(Multiple Choice)
4.8/5 (37)
Filters
- Essay(0)
- Multiple Choice(0)
- Short Answer(0)
- True False(0)
- Matching(0)