Exam 12: Creating Advanced Reports
Exam 1: Getting Started With Access 201368 Questions
Exam 2: Building and Using Queries66 Questions
Exam 3: Using Forms68 Questions
Exam 4: Using Reports68 Questions
Exam 5: Modifying the Database Structure79 Questions
Exam 6: Improving Queries80 Questions
Exam 7: Enhancing Forms81 Questions
Exam 8: Analyzing Data With Reports81 Questions
Exam 9: Importing and Exporting Data81 Questions
Exam 10: Analyzing Database Design Using Northwind77 Questions
Exam 11: Creating Advanced Queries81 Questions
Exam 12: Creating Advanced Reports81 Questions
Exam 13: Creating Macros88 Questions
Exam 14: Creating Macros74 Questions
Exam 15: Administering the Database89 Questions
Exam 16: Access and the Web78 Questions
Exam 17: Getting Started With Microsoft Office 201366 Questions
Select questions type
Explain the purpose of grouping controls together in a report table layout.
Free
(Essay)
4.8/5  (32)
(32)
Correct Answer: Verified
You group controls together in a report table layout in order to more productively format and resize them. Resizing one control in a layout resizes the entire group.
Numbers on a report can be displayed in Currency, Percent, or Standard formats.
Free
(True/False)
4.8/5 (31)
Correct Answer:Verified
True
Layout in Access forms and reports means ____.
Free
(Multiple Choice)
4.8/5 (27)
Correct Answer:Verified
B
The chart type that shows trends over time by connecting points is a(n) ____________________ Chart.
(Short Answer)
4.8/5 (35)
____________________, also called graphs, are visual representations of numeric data that help users see comparisons, patterns, and trends in data.
(Short Answer)
4.9/5 (35)
When charts are displayed in Layout View, you will see which of the following?
(Multiple Choice)
4.8/5 (24)
Suzy has created a report that tracks the animals going in and out of the animal shelter where she works. Each animal's ID number is shown in the AnimalID Footer section. She wants to print each animal's record as a separate document so it can be used in the animal's file. How would she do this?
(Essay)
5.0/5 (30)
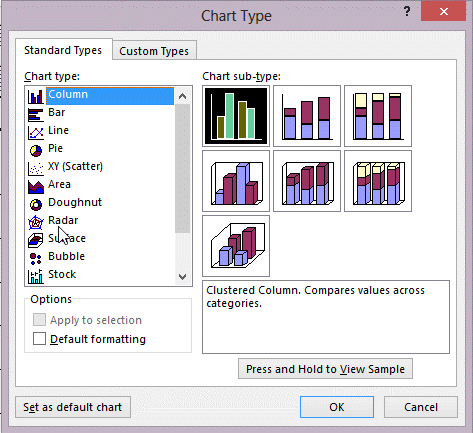 In the figure above, which chart would you most likely use to show parts of a whole, such as the contribution of three sales divisions to the entire company's profits for the year?
(Multiple Choice)
4.9/5 (28)
Before using the Chart Wizard, it's a good idea to plan what specific fields you want the chart to display.
(True/False)
4.8/5 (35)
You can open and close the Group Header and Group Footer sections in the Group, Sort, and Total pane. _________________________
(True/False)
4.9/5 (37)
The ____ area of a chart determines what field the bars on the chart represent.
(Multiple Choice)
4.9/5 (37)
If a chart only has one set of values that represent 100% of something, it is a good candidate for a pie chart.
(True/False)
4.8/5 (32)
Sara works at the local animal shelter. Her boss wants her to use the shelter's database of animals to graph the number of dogs adopted per month for the past 12 months and emphasize whether the trend is increasing or decreasing. What kind of graph would be the best choice? Why?
(Essay)
4.9/5 (27)
Filters
- Essay(0)
- Multiple Choice(0)
- Short Answer(0)
- True False(0)
- Matching(0)