Exam 12: Creating Advanced Reports
Exam 1: Getting Started With Access 201368 Questions
Exam 2: Building and Using Queries66 Questions
Exam 3: Using Forms68 Questions
Exam 4: Using Reports68 Questions
Exam 5: Modifying the Database Structure79 Questions
Exam 6: Improving Queries80 Questions
Exam 7: Enhancing Forms81 Questions
Exam 8: Analyzing Data With Reports81 Questions
Exam 9: Importing and Exporting Data81 Questions
Exam 10: Analyzing Database Design Using Northwind77 Questions
Exam 11: Creating Advanced Queries81 Questions
Exam 12: Creating Advanced Reports81 Questions
Exam 13: Creating Macros88 Questions
Exam 14: Creating Macros74 Questions
Exam 15: Administering the Database89 Questions
Exam 16: Access and the Web78 Questions
Exam 17: Getting Started With Microsoft Office 201366 Questions
Select questions type
The text in a form or report tab is determined by the form or report's Title property. _________________________
(True/False)
4.8/5  (31)
(31)
To change the color of the bars on a chart you must work in Report View. _________________________
(True/False)
4.8/5 (40)
Charts can be added to forms or queries . _________________________
(True/False)
4.9/5 (34)
Ben works at the local animal shelter. His boss wants him to use the shelter's database of animals to graph the monthly adoptions of cats vs. dogs for the past 12 months. What kind of graph would be the best choice? Why?
(Essay)
4.8/5 (33)
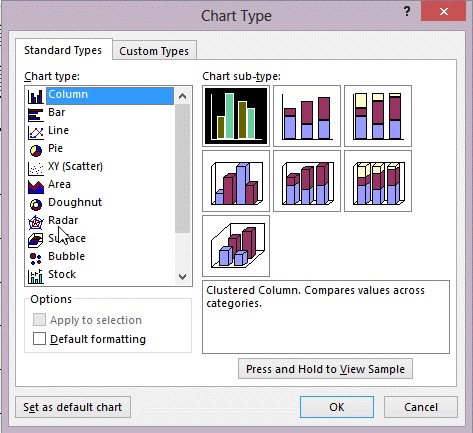 In the figure above, which chart would you most likely use to show trends over time?
(Multiple Choice)
4.9/5 (37)
In a report, the Narrow margin option sets all four margins to 0.25". _________________________
(True/False)
5.0/5 (40)
 In the figure above, which chart would you most likely use to show comparisons of values, such as annual sales for a different product for several sales representatives?
(Multiple Choice)
4.8/5 (39)
The ____ layout positions labels across the top in the Page Header section forming columns of data with text boxes positioned in the Detail section.
(Multiple Choice)
4.8/5 (26)
Which chart type would use horizontal bars to show annual sales for different sales representatives?
(Multiple Choice)
4.9/5 (43)
Access provides a(n) ____________________ Wizard that steps you through the process of creating charts within forms and reports.
(Short Answer)
4.8/5 (40)
Which of the following is NOT a formatting property available for many report controls?
(Multiple Choice)
4.9/5 (34)
Which chart type would best show cumulative sales by several representatives over time?
(Multiple Choice)
4.7/5 (33)
Match the report problems with the probable solution.
Correct Answer: Verified
Premises:
Responses:
(Matching)
4.7/5 (25)
Filters
- Essay(0)
- Multiple Choice(0)
- Short Answer(0)
- True False(0)
- Matching(0)