Exam 4: Demand and Supply
Exam 1: Getting Started347 Questions
Exam 2: The U.S.and Global Economies211 Questions
Exam 3: The Economic Problem283 Questions
Exam 4: Demand and Supply334 Questions
Exam 5: Elasticities of Demand and Supply342 Questions
Exam 6: Efficiency and Fairness of Markets362 Questions
Exam 7: Government Actions in Markets248 Questions
Exam 8: Taxes270 Questions
Exam 9: Global Markets in Action281 Questions
Exam 10: Externalities301 Questions
Exam 11: Public Goods and Common Resources180 Questions
Exam 12: Markets with Private Information103 Questions
Exam 13: Consumer Choice and Demand295 Questions
Exam 14: Production and Cost274 Questions
Exam 15: Perfect Competition285 Questions
Exam 16: Monopoly384 Questions
Exam 17: Monopolistic Competition221 Questions
Exam 18: Oligopoly228 Questions
Exam 19: Markets for Factors of Production188 Questions
Exam 20: Economic Inequality164 Questions
Select questions type
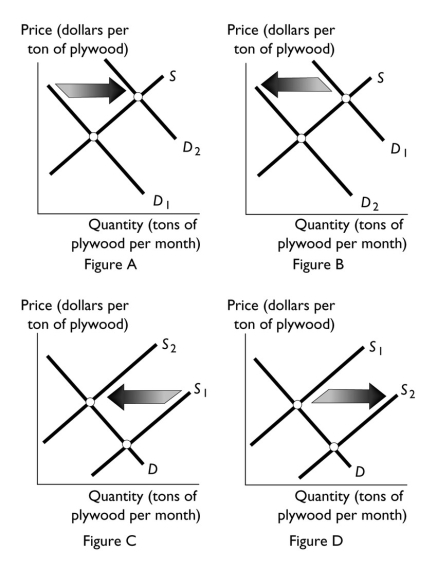 -Contractors can use plywood or brick to construct walls.Suppose the price of bricks increases.Which of the figures above best illustrates the effect of this change on the market for plywood?
(Multiple Choice)
4.8/5  (34)
(34)
Milk can be used to produce cheese or butter.If the price of a pound of butter rises,what happens to the supply of cheese?
(Multiple Choice)
4.7/5 (34)
If good weather conditions result in a larger than normal crop of peaches,then the
(Multiple Choice)
4.8/5 (40)
Quantity demanded (tons of cat food per year) Price (dollars per pound of cat food) Quantity supplied (tons of cat food per year) 52 1.00 15 46 1.50 26 43 2.00 34 40 2.50 40 35 3.00 44
-The above table gives the demand and supply schedules for cat food.If the price is $3.00 per pound of cat food,will there be a shortage,a surplus,or is this price the equilibrium price? If there is a shortage,how much is the shortage? If there is a surplus,how much is the surplus? If $3.00 is the equilibrium price,what is the equilibrium quantity?
(Essay)
4.8/5 (36)
Suppose that the demand curve for desktop computers shifts rightward and at the same time the supply curve shifts leftward.Which of the following could have caused these shifts?
(Multiple Choice)
4.8/5 (36)
Consider the market for bread.If the price of wheat rises,then the
(Multiple Choice)
4.8/5 (37)
If the demand for digital cameras increases when consumers' incomes rise,then digital cameras are
(Multiple Choice)
4.8/5 (31)
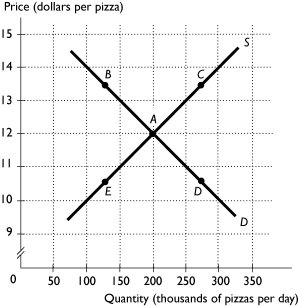 -The above figure shows the market for pizza.The market is in equilibrium when the cheese used to produce pizza falls in price.What point represents the most likely new price and quantity?
(Multiple Choice)
4.9/5 (44)
Suppose that the equilibrium price and quantity of new houses both increase.Which of the following could be a cause of this change?
(Multiple Choice)
4.8/5 (25)
When the demand for a good decreases,its equilibrium price ________ and equilibrium quantity ________.
(Multiple Choice)
4.8/5 (24)
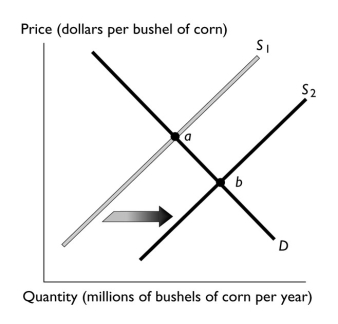 -The above figure illustrates the market for corn.If point "a" represents the original equilibrium and point "b" the new equilibrium,which of the following could have caused the change?
(Multiple Choice)
4.8/5 (31)
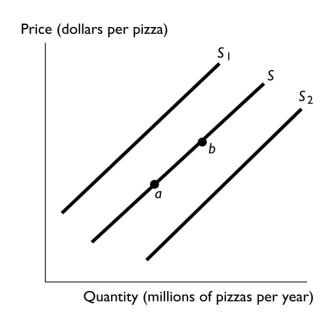 -In the above figure,the movement from point a to point b reflects
(Multiple Choice)
4.9/5 (43)
What leads to a decrease in the quantity demanded of a good or service?
(Essay)
4.8/5 (40)
Pizza and tacos are substitutes,and the price of a pizza increases.Which of the following correctly indicates what happens?
(Multiple Choice)
4.9/5 (29)
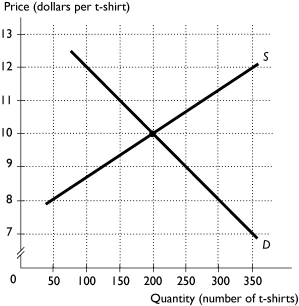 -The above figure shows the market for game day t-shirts.If the price of t-shirts is $8,then
(Multiple Choice)
4.7/5 (35)
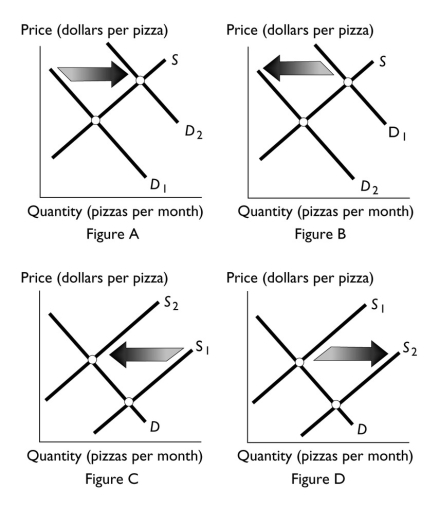 -Which figure above shows the effect of an increase in the cost of the tomato sauce used to produce pizza?
(Multiple Choice)
4.9/5 (42)
The "law of demand" refers to the fact that,other things remaining the same,when the price of a good rises,
(Multiple Choice)
4.7/5 (35)
If income increases and the demand for bus rides decreases,
(Multiple Choice)
4.8/5 (26)
-In the figure above,if point "a" represents the original equilibrium and point "b" the new equilibrium,then
(Multiple Choice)
4.9/5 (35)
Filters
- Essay(0)
- Multiple Choice(0)
- Short Answer(0)
- True False(0)
- Matching(0)