Exam 4: Demand and Supply
Exam 1: Getting Started347 Questions
Exam 2: The U.S.and Global Economies211 Questions
Exam 3: The Economic Problem283 Questions
Exam 4: Demand and Supply334 Questions
Exam 5: Elasticities of Demand and Supply342 Questions
Exam 6: Efficiency and Fairness of Markets362 Questions
Exam 7: Government Actions in Markets248 Questions
Exam 8: Taxes270 Questions
Exam 9: Global Markets in Action281 Questions
Exam 10: Externalities301 Questions
Exam 11: Public Goods and Common Resources180 Questions
Exam 12: Markets with Private Information103 Questions
Exam 13: Consumer Choice and Demand295 Questions
Exam 14: Production and Cost274 Questions
Exam 15: Perfect Competition285 Questions
Exam 16: Monopoly384 Questions
Exam 17: Monopolistic Competition221 Questions
Exam 18: Oligopoly228 Questions
Exam 19: Markets for Factors of Production188 Questions
Exam 20: Economic Inequality164 Questions
Select questions type
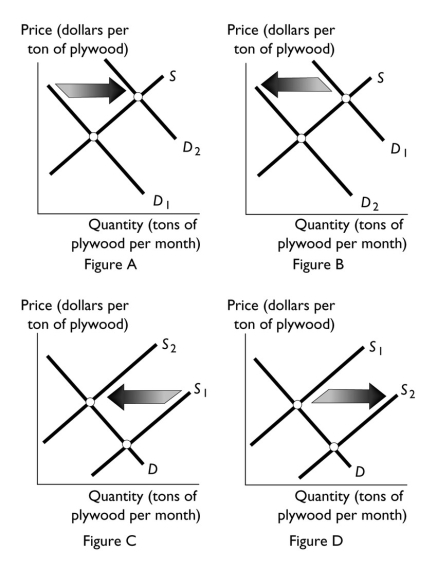 -In an effort to protect endangered species from the effects of logging in America's national forests,the federal government passes a law prohibiting logging in most of the state of Washington.Which of the figures above best illustrates the effect of this new law?
Free
(Multiple Choice)
4.9/5  (33)
(33)
Correct Answer: Verified
C
An increase in the equilibrium price and a decrease in the equilibrium quantity can be the result of
Free
(Multiple Choice)
4.9/5 (38)
Correct Answer:Verified
C
Which of the following describes the law of demand? When other things remain the same,as
Free
(Multiple Choice)
4.7/5 (40)
Correct Answer:Verified
A
Suppose that the productivity used to produce computers advances.How does this change affect the supply of computers and the supply curve of computers?
(Essay)
4.7/5 (30)
The American Dairy Association starts a highly successful advertising campaign that makes most people want to drink more milk.As a result,
(Multiple Choice)
4.9/5 (36)
Soda and hot dogs are complements for one another.If a shortage of carbonated water leads to an increase in the price of soda,then the
(Multiple Choice)
4.9/5 (35)
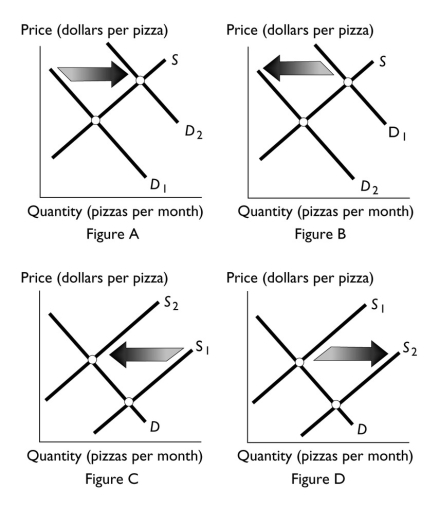 -Which figure above shows the effect of a decrease in the number of pizza sellers?
(Multiple Choice)
4.8/5 (38)
 -In the above figure,an increase in cost of the cheese used to produce pizza
(Multiple Choice)
4.7/5 (33)
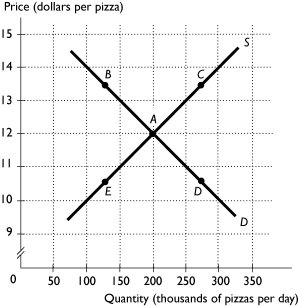 -The above figure shows the market for pizza.The market is in equilibrium when the wages paid pizza workers increases.What point represents the most likely new price and quantity?
(Multiple Choice)
4.8/5 (29)
Which of the following increases the demand for a good or service?
(Multiple Choice)
4.8/5 (45)
Price (dollars per cellular phone) Quantity demanded (thousands) Quantity supplied (thousands) 100 50 100 80 55 80 50 60 60 20 100 40
-Using the data in the table above,the equilibrium quantity and equilibrium price for a cellular telephone is
(Multiple Choice)
4.8/5 (35)
If the number of companies producing memory chips increases,then the
(Multiple Choice)
4.7/5 (33)
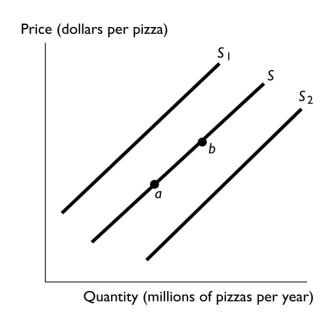
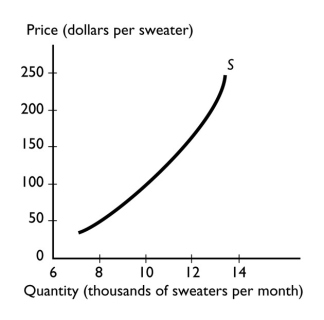 -The graph illustrates the supply of sweaters.As the technology used to produce sweaters improves,the
(Multiple Choice)
4.8/5 (35)
Car insurance and cars are complements.If the price of car insurance increases,the
(Multiple Choice)
4.7/5 (48)
Oil refiners can refine a barrel of petroleum so that it yields either more home heating oil or more diesel fuel.If the price of diesel fuel falls,there is
(Multiple Choice)
4.9/5 (41)
Filters
- Essay(0)
- Multiple Choice(0)
- Short Answer(0)
- True False(0)
- Matching(0)