Exam 3: Paired Data and Graphing Ordered Pairs
Exam 1: Notation and Symbols329 Questions
Exam 2: Simplifying Expressions285 Questions
Exam 3: Paired Data and Graphing Ordered Pairs217 Questions
Exam 4: Multiplication With Exponents300 Questions
Exam 5: The Greatest Common Factor and Factoring by Grouping295 Questions
Exam 6: Reducing Rational Expressions to Lowest Terms263 Questions
Exam 7: Review of Solving Equations262 Questions
Exam 8: The Slope of a Line190 Questions
Exam 9: Rational Exponents264 Questions
Exam 10: Completing the Square187 Questions
Exam 11: Exponential Functions226 Questions
Exam 12: The Circle95 Questions
Exam 13: Sequences190 Questions
Select questions type
Solve the system by solving one of the equations for  or
or  and then use the substitution method.
 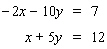 If the system is dependent or inconsistent , or if there is no solution , indicate this.
(Short Answer)
4.8/5  (36)
(36)
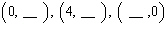
For the following equation, complete the given ordered pairs. 
(Multiple Choice)
5.0/5 (39)
Solve the system of linear equations by the elimination method.  If the system is dependent or inconsistent , indicate this.
(Short Answer)
4.8/5 (29)
Solve the system of linear equations by the elimination method. 
(Multiple Choice)
4.9/5 (36)
Solve the system using the substitution method.  If the system is dependent or inconsistent , or if there is no solution , indicate this.
(Short Answer)
4.9/5 (24)
In the graph below, name the linear inequality in two variables that is represented by the shaded region. 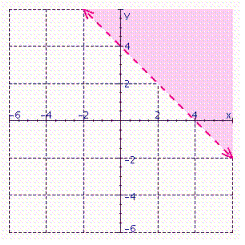
(Multiple Choice)
4.9/5 (30)
From the graph below, find the x - and y -intercepts for the line. 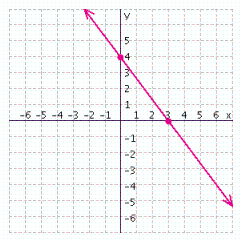 x -intercept = __________ y -intercept = __________
(Short Answer)
4.7/5 (27)
In the graph below, name the linear inequality in two variables that is represented by the shaded region. 
(Short Answer)
4.8/5 (26)
Solve the system of linear equations by the elimination method.  If the system is dependent or inconsistent , indicate this.
(Short Answer)
4.9/5 (32)
Jane is deciding between two sales positions. She can work for Marcy s and receive  per hour or for Gigi s, where she earns
  per hour but also receives a
  commission per week. The two lines in the following figure represent the money Jane will make for working at each of the jobs.
 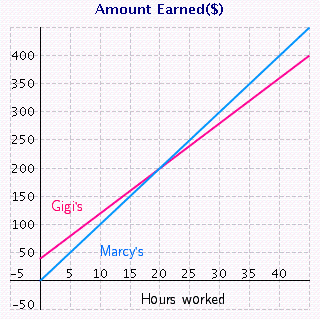 From the sketch of the graphed lines, how many hours would Jane have to work to earn the same amount at each of the positions? __________ hours If Jane expects to work less than
  hours a week, which job should she choose - Gigi s or Marcy s? __________ If Jane expects to work more than
  hours a week, which job should she choose - Gigi s or Marcy s? __________
(Short Answer)
4.8/5 (35)
In the graph below, name the linear inequality in two variables that is represented by the shaded region. 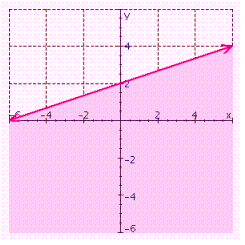
(Multiple Choice)
4.9/5 (38)
Solve the system using the substitution method.  If the lines coincide, answer dependent . If the lines are parallel, answer no solution .
(Multiple Choice)
4.9/5 (28)
Daniel is trying to decide whether to buy a car or a truck. The truck he is considering will cost him  a month in loan payments, and it gets
  miles per gallon in gas mileage. The car will cost
  a month in loan payments, but it gets
  miles per gallon in gas mileage. Daniel estimates that he will pay
  per gallon for gas. This means that the monthly cost to drive the truck
  miles will be
 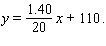 The total monthly cost to drive the car
  miles will be
 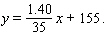 The following figure shows the graph of each equation.
 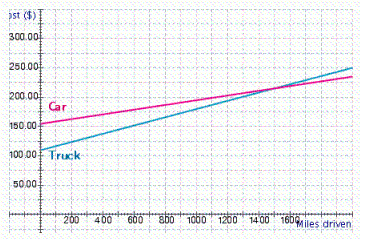 At how many miles do the car and the truck cost the same to operate?
(Multiple Choice)
4.8/5 (35)
Filters
- Essay(0)
- Multiple Choice(0)
- Short Answer(0)
- True False(0)
- Matching(0)