Exam 2: Linear Functions and Models
Exam 1: Data, Functions, and Models81 Questions
Exam 2: Linear Functions and Models70 Questions
Exam 3: Exponential Functions and Models110 Questions
Exam 4: Logarithmic Functions and Exponential Modela74 Questions
Exam 5: Quadratic Functions and Models73 Questions
Exam 6: Power, Polynomial, and Rational Functions71 Questions
Exam 7: Systems of Equations and Data in Categories71 Questions
Select questions type
A swimming pool is being filled with water. The linear equation  models the number of gallons w of water in the pool at time t (in minutes). If the pool has a capacity of 19500 gallons, how long will it take for the pool to fill to capacity? (Rounded to the nearest tenth)
(Multiple Choice)
4.9/5  (39)
(39)
Which one of the following graphs illustrates the equation y = 4 
 x ?
x ?
(Multiple Choice)
4.9/5 (39)
Which one of the following is the slope of a line that is perpendicular to the line shown in the graph below? 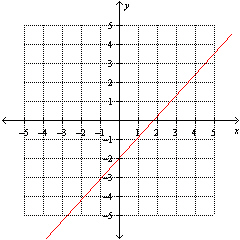
(Multiple Choice)
4.7/5 (19)
The following table shows the swim times s for a certain swimmer for the 400-meter freestyle swims during the years 2001 to 2007. Let represent the year 2001.
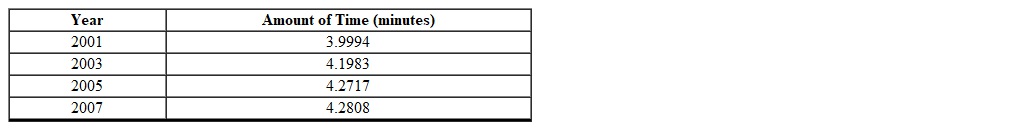 Which one of the following equations is the line of best fit for the data provided? (Rounded to the nearest ten-thousandths)
(Multiple Choice)
5.0/5 (39)
If  and
and  , then the average rate of change of
  between
  and
and  is which of the following:
(Multiple Choice)
5.0/5 (31)
After taking a bath you begin to drain the water from the bathtub. The water drains at 2.5 gallons per minute. After 9 minutes, there are 27 gallons of water remaining. Which one of the following linear equations describe the number of gallons of water in the tub relative to the number of minutes since you began draining the tub?
(Multiple Choice)
4.9/5 (33)
A ball is thrown straight upward from a bridge and then falls all the way to the ground (past the bridge). The ball s height h (in feet) above the ground t seconds after the ball is thrown is given by 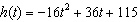 . Find the average speed in the height of the ball from time
  seconds to
  seconds. (Rounded to the nearest thousandth)
(Multiple Choice)
4.9/5 (32)
Judy is making fruit punch by mixing water with fruit juice crystals. In order for the fruit punch to taste fruity, Judy mixes 2.5 cups of fruit juice crystals with 11 cups of water. The number of cups of water w is proportional to the number of cups of fruit juice crystals c . If Judy has 40 cups of water, how many cups of fruit juice crystals should she mix with the water? (Rounded to the nearest tenth)
(Multiple Choice)
4.7/5 (32)
Biologists observed that as the temperature t (in degrees Fahrenheit) increased near a local ant colony, the speed s that the ants traveled also increased. The data from this observation is shown in the table below. 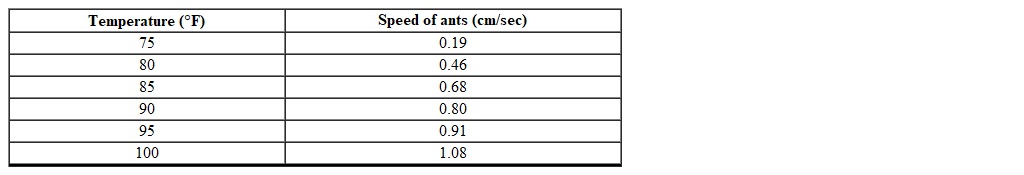 Find the linear regression equation based on the data provided to determine how fast the ants will walk with the temperature is 105 ºF. (Rounded to the nearest hundredth)
(Multiple Choice)
4.8/5 (30)
The following table shows the values of airfare for a roundtrip ticket from San Antonio, TX to Portland, OR.
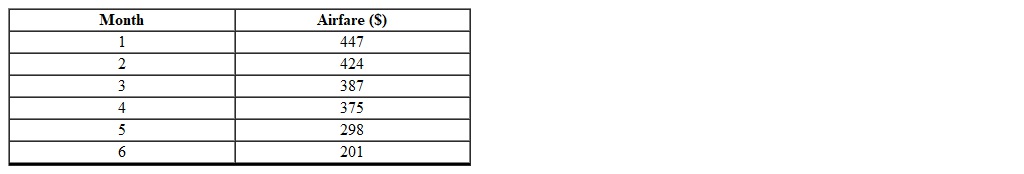 Which one of the following is the equation for a line of best fit for the data provided? (Rounded to the nearest tenth)
(Multiple Choice)
4.8/5 (29)
If the slope of one equation is  and the slope of another equation is
  , then the graphs of these equations are perpendicular.
(True/False)
4.8/5 (38)
A beanstalk grows at a constant rate. The beanstalk s height (inches) as a function of time (days) is modeled by  . At what rate is the beanstalk growing?
(Multiple Choice)
4.9/5 (44)
The following table shows the values of the number of gallons of water used by a family during the month of July.  Find the linear regression equation based on the data provided to determine the number of gallons of water used on day 10. (Rounded to the nearest hundredth)
(Multiple Choice)
4.8/5 (36)
An economist models the market for rice by the following equations. 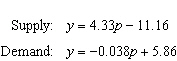 Let p represent the price per bushel (in dollars) and y represent the number of bushels produced and sold (in millions). Find the best approximation for the equilibrium price.
(Multiple Choice)
4.9/5 (28)
The distance d of a car traveling in a straight line is a function of the number of minutes traveled n . Using the data provided in the table for the car's distance and number of minutes, determine which 10-second interval of time had the highest average rate of change.

(Multiple Choice)
4.8/5 (34)
A printing company determines that to print a large format poster, it costs $75 to set up the production process. Each poster that is printed costs $25 in material and labor. The printing company sells these posters to marketing firms for $58 each. Determine the number of posters the printing company must sell to break even. [Note: profit = revenue - cost]
(Multiple Choice)
4.9/5 (33)
Filters
- Essay(0)
- Multiple Choice(0)
- Short Answer(0)
- True False(0)
- Matching(0)