Exam 4: Measures of Central Tendency and Variability
Which of the following is not a measure of variability?
E
Define variance.
Variance is a statistical measure that represents the degree of spread or dispersion of a set of values. Specifically, it quantifies how much the numbers in a data set deviate from the mean (average) of the set. In other words, variance measures how far each number in the set is from the mean and thus from every other number in the set.
Mathematically, variance is calculated by taking the average of the squared differences between each data point and the mean. The formula for variance (σ²) for a population (the entire set of values) is:
σ² = Σ (xi - μ)² / N
where:
- Σ is the summation symbol, indicating that you sum over all data points.
- xi represents each data point in the population.
- μ is the mean (average) of the population.
- N is the number of data points in the population.
For a sample (a subset of values from the population), the formula is slightly different to correct for the bias that comes from estimating the population variance from a sample:
s² = Σ (xi - x̄)² / (n - 1)
where:
- s² is the sample variance.
- xi represents each data point in the sample.
- x̄ is the sample mean.
- n is the number of data points in the sample.
- The denominator (n - 1) is known as the degrees of freedom.
Variance is a foundational concept in statistics and probability theory, and it is crucial for various analytical techniques, including hypothesis testing, ANOVA, regression analysis, and in finance for portfolio theory and risk management. However, because variance is in squared units of the original data, it is often more intuitive to use the standard deviation, which is the square root of the variance, to understand the variability in the same units as the original data.
The mean is _______ sensitive to extreme scores than the median.
A
Considering again the information in problem 40, what would be the effect of adding those same new scores on the value of s ?
The equation used for sample standard deviation is an estimate of the population standard deviation.
If the distribution contains unbalanced extreme scores, the mean is a better descriptor than the median.
A history professor gives a quiz to his class and records the following scores: 13, 11, 11, 9, 12, 13, 16, 14, 11, 10, 8, 13, 20. The range for this distribution is _________.
If 5 points are added to each score in a distribution, which of the following will happen?
In a certain statistics course, four exams were given. Each student s grade was based on a weighted average of his exam scores. The first two tests had weights of 1, the third test had a weight of 2, and the final test had a weight of 3. The exam scores for one student are listed below. 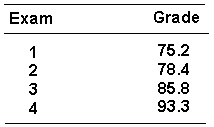 The student s overall average was _________.
The equation for the sum of squares of a sample is ΣS = ΣX2 - ( Σ X)2/N
What is the value of ΣX, if 900 students had a mean of 78.2 on a test?
With grouped scores, the mode is the mid-point of the interval with the highest frequency.
In a negatively skewed distribution, the mean will generally be _______ the median.
Given the following set of scores X : 10, 12, 6, 8, 9, 11, 13, 13, 5, 0, 1 What is the variance?
Which of the following is not a measure of central tendency?
Filters
- Essay(0)
- Multiple Choice(0)
- Short Answer(0)
- True False(0)
- Matching(0)