Exam 4: Measures of Central Tendency and Variability
Exam 1: Statistics and Scientific Method102 Questions
Exam 2: Basic Mathematical and Measurement Concepts110 Questions
Exam 3: Frequency Distributions116 Questions
Exam 4: Measures of Central Tendency and Variability125 Questions
Exam 5: The Normal Curve and Standard Scores105 Questions
Exam 6: Correlation139 Questions
Exam 7: Linear Regression101 Questions
Exam 8: Random Sampling and Probability123 Questions
Exam 9: Binomial Distribution121 Questions
Exam 10: Introduction to Hypothesis Testing: Using the Sign Test141 Questions
Exam 11: Power103 Questions
Exam 12: Sampling Distributions, Sampling Distribution of the Mean: the Normal Deviate Z Test135 Questions
Exam 13: Students T Test for Single Samples121 Questions
Exam 14: Students T Test for Correlated and Independent Groups145 Questions
Exam 15: Introduction to the Analysis of Variance218 Questions
Exam 16: Introduction to the Two-Way Analysis of Variance115 Questions
Exam 17: Chi-Square and Other Nonparametric Tests170 Questions
Select questions type
A statistics class taught by Dr. X had 30 students who obtained an average test score of 82.5. A class taught by Dr. Why had 20 students who ended up with an average score of 79.6. Dr. Zee (you guessed it) had 23 students who obtained an average score of 96.0. What was the average score for all the students combined?
(Short Answer)
4.8/5  (31)
(31)
If the distribution is symmetrical, which is the best measure of central tendency?
(Multiple Choice)
4.7/5 (35)
Consider a distribution with N = 100,  = 50, and
  = 9875. If 10 new scores of 50 were added to the distribution, what would happen to the sum of squares?
(Multiple Choice)
4.8/5 (43)
The most commonly encountered measure of central tendency is the _________.
(Multiple Choice)
4.9/5 (37)
A car company wanted to know how many miles per gallon an experimental car got after a series of tests. The following data were obtained. Miles per gallon: 31.2, 28.6, 36.4, 37.3, 30.1, 29.0, 32.7, 31.9

(Not Answered)
This question doesn't have any answer yet
The mean must have a value equal to one of the scores in the distribution.
(True/False)
4.8/5 (38)
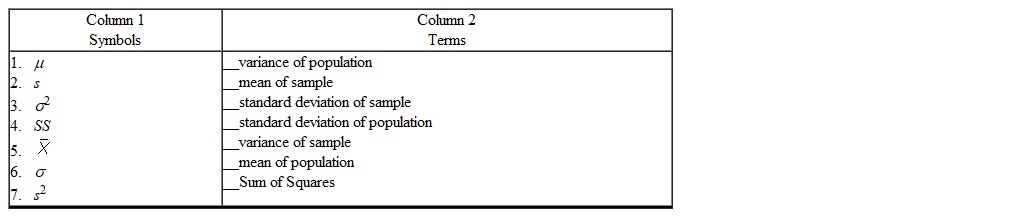
Assume that the standard deviation of one distribution equals 15 and the standard deviation of another distribution is equal to 23. Which of the following distributions is more likely to represent the case where s = 15 if the other distribution's standard deviation equals 23? 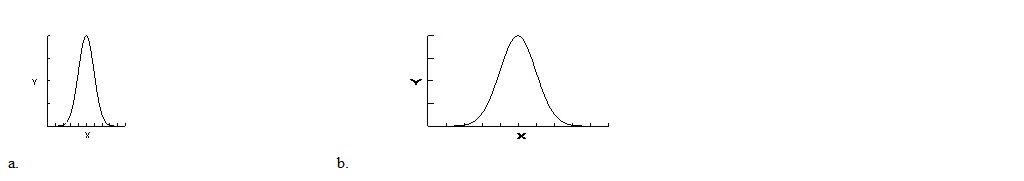
(Not Answered)
This question doesn't have any answer yet
If a constant of 5 is subtracted from all of the scores, the standard deviation _________.
(Multiple Choice)
4.8/5 (35)
Consider the following two sets of scores. X : 80, 70, 55, 63, 72 Y : 50, 52, 59, 60

(Not Answered)
This question doesn't have any answer yet
Assume one has a set of 35 scores with  = 100 and s = 9. If 5 scores, each equal to 100 were added to the distribution, what effect would this have on
  ?
?
(Multiple Choice)
4.9/5 (38)
An instructor decides to weight the scores on three tests differently. The first test is weighted only half as much as the second test. The third test is the final and it is weighted twice as much as the second test. The mean grade on the first test was 68, the mean of the second test was 75, and the mean on the third test was 80. What is the mean grade for all three tests, assuming the same number of students took all the exams?
(Short Answer)
4.9/5 (29)
The mean is the most sensitive measure of central tendency to extreme scores.
(True/False)
4.8/5 (34)
Consider the following scores: 21, 22, 22, 0.1, 20, 25, 28, 26, 23, 19, 0.5. Which of the measures listed below would give the best description of the central tendency of these scores?
(Multiple Choice)
4.9/5 (41)
An industrial psychologist observed 8 drill-press operators for one working day. She recorded the number of times each operator pressed the "faster" button instead of the "stop" button to determine whether the design of the control panel was contributing to the high rate of accidents in the plant. The resulting scores were as follows: 5, 2, 8, 2, 3, 2, 4, 12 The mode for this distribution is _________.
(Multiple Choice)
4.8/5 (27)
A history professor gives a quiz to his class and records the following scores: 13, 11, 11, 9, 12, 13, 16, 14, 11, 10, 8, 13, 20. The median for this distribution is _________.
(Multiple Choice)
4.8/5 (28)
Which of the following do (does) not measure average dispersion?
(Multiple Choice)
4.8/5 (43)
Write the number of the symbol shown in Column 1 in the space provided to the left of the term in Column 2 that it represents.
(Not Answered)
This question doesn't have any answer yet
Filters
- Essay(0)
- Multiple Choice(0)
- Short Answer(0)
- True False(0)
- Matching(0)