Exam 14: Students T Test for Correlated and Independent Groups
Exam 1: Statistics and Scientific Method102 Questions
Exam 2: Basic Mathematical and Measurement Concepts110 Questions
Exam 3: Frequency Distributions116 Questions
Exam 4: Measures of Central Tendency and Variability125 Questions
Exam 5: The Normal Curve and Standard Scores105 Questions
Exam 6: Correlation139 Questions
Exam 7: Linear Regression101 Questions
Exam 8: Random Sampling and Probability123 Questions
Exam 9: Binomial Distribution121 Questions
Exam 10: Introduction to Hypothesis Testing: Using the Sign Test141 Questions
Exam 11: Power103 Questions
Exam 12: Sampling Distributions, Sampling Distribution of the Mean: the Normal Deviate Z Test135 Questions
Exam 13: Students T Test for Single Samples121 Questions
Exam 14: Students T Test for Correlated and Independent Groups145 Questions
Exam 15: Introduction to the Analysis of Variance218 Questions
Exam 16: Introduction to the Two-Way Analysis of Variance115 Questions
Exam 17: Chi-Square and Other Nonparametric Tests170 Questions
Select questions type
If n 1 = n 2 and s 2 is unknown, then the z test can be used to analyze the data from an independent groups design.
(True/False)
4.8/5  (32)
(32)
Ties are included in the analysis when using the t test for correlated groups.
(True/False)
4.9/5 (39)
The power of the t test increases with increases in the effect of the independent variable.
(True/False)
4.9/5 (40)
A drug company wants to evaluate the effects of a new tonic on stimulating new hair growth. Two comparable groups of male volunteers are tested. Group 1 is given a mixture of chicken fat and bear grease as a control tonic. Group 2 gets the new tonic. The number of new hairs are counted one month after the onset of tonic use. The results are shown below: 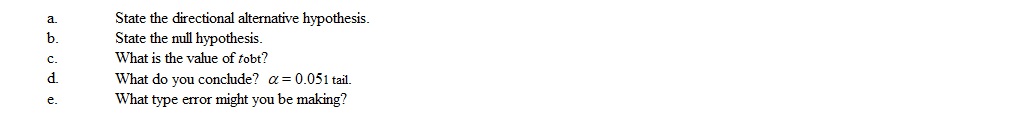
(Not Answered)
This question doesn't have any answer yet
A health educator wants to evaluate the effect of a dental film on the frequency with which children brush their teeth. A random selection of 8 children are used for the experiment. First, a baseline of the number of times the children brush their teeth over a month's period is established. Next, the children are shown the dental film and again the number of teeth brushings are recorded for a month. The following data are recorded.  The obtained value of the appropriate statistic is _________.
(Multiple Choice)
4.8/5 (30)
Five students were tested before and after taking a class to improve their study habits. They were given articles to read which contained a known number of facts in each story. After the story each student listed as many facts as he/she could recall. The following data was recorded. 
(Not Answered)
This question doesn't have any answer yet
Having just made what you feel is to be a Type II error, using an independent groups design and a t test analysis, which of the following might you do in the next experiment to reduce the probability of a Type II error?
(Multiple Choice)
4.7/5 (46)
In an experiment using the independent groups design, there are 10 subjects in one group and 12 subjects in the other group. The sampling distribution of t that is appropriate for that experiment is identical to the t distribution that is appropriate for a single sample design with _________ subjects.
(Multiple Choice)
4.9/5 (30)
In a correlated groups design with a directional H 1 , if H 0 is correct, the sample set of difference scores must be a random sample from a population of difference scores with µ D = 0.
(True/False)
4.7/5 (31)
Write the number of the symbol shown in Column 1 in the space provided to the left of the term in Column 2 that it represents.
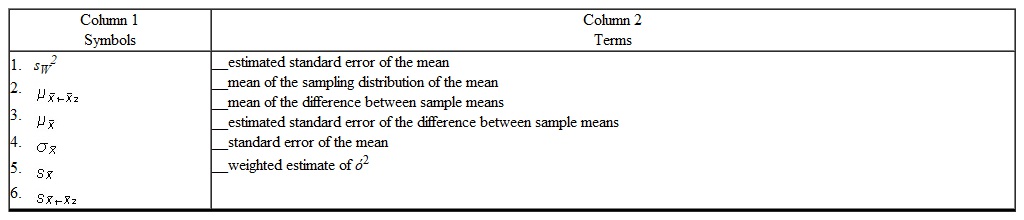
(Not Answered)
This question doesn't have any answer yet
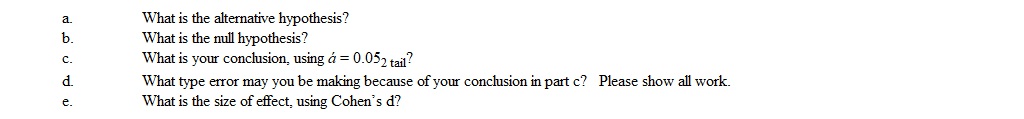
A school psychologist is interested in determining if children with attention deficit disorder (ADD) learn better if English literature is read to them rather than having them read the material themselves. A random sample of 10 sixth graders with ADD is selected and divided into two groups of 5 each. One of the groups has a story read to them (Listening Group) and the other reads the story themselves (Reading Group). A quiz on the story is given after each group has finished reading or hearing the story. The following scores were obtained with 20 being a perfect score. 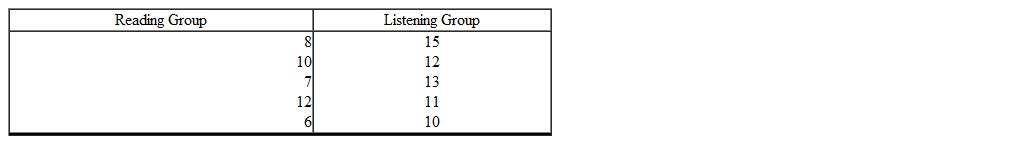 The 95% confidence interval for equals _________.
(Multiple Choice)
4.9/5 (35)
Define sampling distribution of the difference between sample means.
(Short Answer)
4.8/5 (32)
There is a greater chance of making a Type I error using a = 0.05 when using the t test for correlated groups then when using the sign test on the same scores.
(True/False)
4.9/5 (37)
A political candidate wishes to determine if endorsing increased social spending is likely to affect her standing in the polls. She has access to data on the popularity of several other candidates who have endorsed increased spending. The data was available both before and after the candidates announced their positions on the issue. The data are as follows: Assuming no other factors were influencing the popularity ratings;
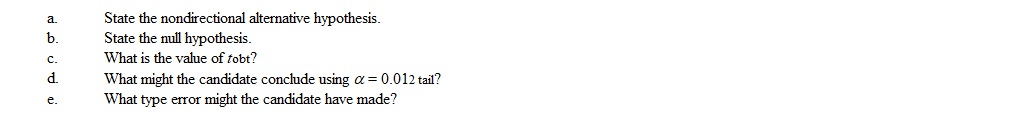
(Not Answered)
This question doesn't have any answer yet
Generally, the higher the magnitude of r between the scores of both groups the more powerful is the t test for correlated groups.
(True/False)
4.7/5 (35)
Filters
- Essay(0)
- Multiple Choice(0)
- Short Answer(0)
- True False(0)
- Matching(0)