Exam 2: Understanding Data: Critical Concepts
Exam 1: An Introduction to Analyzing Inequalities10 Questions
Exam 2: Understanding Data: Critical Concepts10 Questions
Exam 3: Analyzing Gender With the GSS10 Questions
Exam 4: Analyzing Race and Ethnicity With the GSS10 Questions
Exam 5: Analyzing Class With the GSS10 Questions
Exam 6: Analyzing Sexuality With the GSS10 Questions
Exam 7: Analyzing Inequalities in Families10 Questions
Exam 8: Analyzing Inequalities in Education10 Questions
Exam 9: Analyzing Inequalities in the Economy and at Work10 Questions
Select questions type
Use Figure 2.2 to answer the following 3 questions.
Figure 2.2
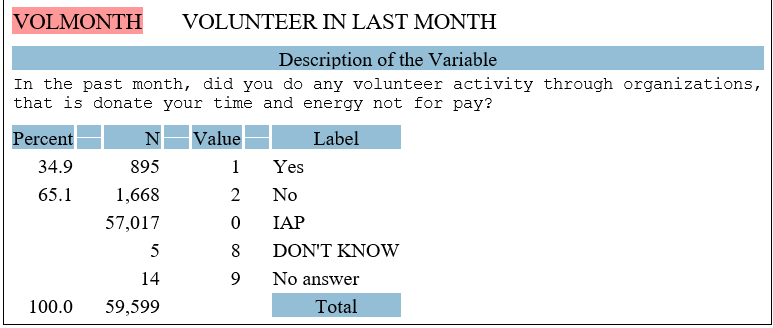 -Of those who provided valid responses, what percent of respondents indicated they did NOT participate in volunteer activity through an organization, in the past month?
Free
(Multiple Choice)
4.8/5  (32)
(32)
Correct Answer: Verified
B
Use Figure 2.3 to answer the following questions.
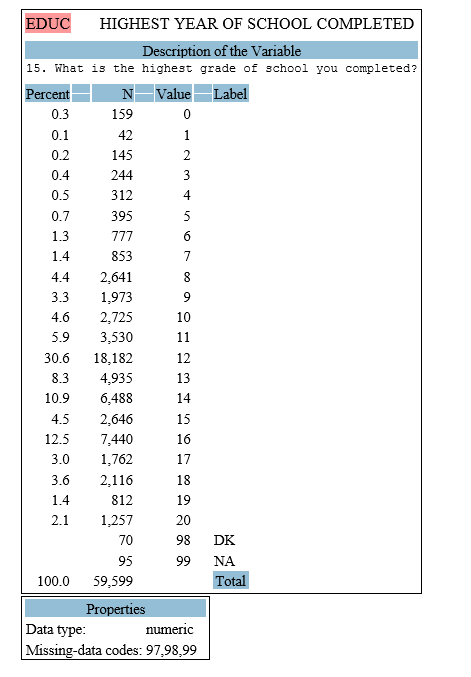 -Which of the following statements is NOT correct, according to Figure 2.3?
Free
(Multiple Choice)
4.7/5 (31)
Correct Answer:Verified
C
Use Figure 2.1 to answer the following 3 questions.
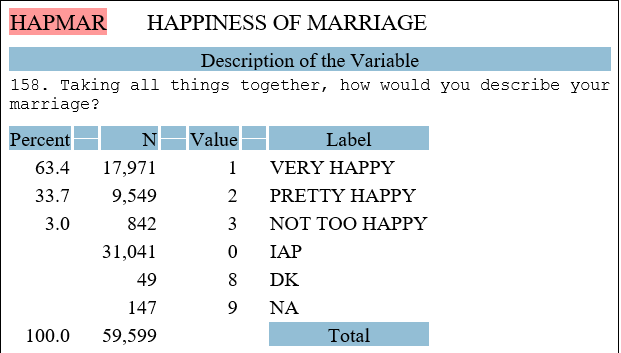 -The variable, HAPMAR, is best described as what type of variable?
Free
(Multiple Choice)
4.9/5 (37)
Correct Answer:Verified
B
Use Figure 2.3 to answer the following questions.
-Using the information presented in Figure 2.3, approximately what percentage of GSS respondents indicated that they have16 years of education?
(Multiple Choice)
4.7/5 (35)
Use Figure 2.3 to answer the following questions.
-The variable EDUC, shown in Figure 2.3, corresponds to the number of years of formal education that a respondent has. This variable is best described as a(n):
(Multiple Choice)
4.9/5 (25)
Use Figure 2.2 to answer the following 3 questions.
Figure 2.2
-The variable, VOLMONTH, is best described as what type of variable?
(Multiple Choice)
4.8/5 (35)
Use Figure 2.1 to answer the following 3 questions.
-The number 31,041 in Figure 2.1 indicates that:
(Multiple Choice)
4.9/5 (24)
Use Figure 2.3 to answer the following questions.
-Using the information presented in Figure 2.3, what is the average number of years of education that respondents report having?
(Multiple Choice)
4.9/5 (31)
Use Figure 2.2 to answer the following 3 questions.
Figure 2.2
-How many respondents indicated that they had done volunteer activity through an organization, in the past month?
(Multiple Choice)
4.8/5 (33)
Use Figure 2.1 to answer the following 3 questions.
-Which of the following best describes the modal category for the variable, HAPMAR?
(Multiple Choice)
4.9/5 (33)
Filters
- Essay(0)
- Multiple Choice(0)
- Short Answer(0)
- True False(0)
- Matching(0)