Exam 14: Network Goods
Exam 1: Exploring Economics3 Questions
Exam 2: Production, Economic Growth, and Trade17 Questions
Exam 3: Supply and Demand26 Questions
Exam 4: Markets and Government24 Questions
Exam 5: Elasticity407 Questions
Exam 6: Consumer Choice and Demand394 Questions
Exam 7: Production and Costs322 Questions
Exam 8: Perfect Competition333 Questions
Exam 9: Monopoly309 Questions
Exam 10: Monopolistic Competition, Oligopoly, and Game Theory307 Questions
Exam 11: The Labor Market393 Questions
Exam 12: Land, Capital Markets, and Innovation267 Questions
Exam 13: Externalities and Public Goods342 Questions
Exam 14: Network Goods353 Questions
Exam 15: Poverty and Income Distribution303 Questions
Exam 16: International Trade17 Questions
Select questions type
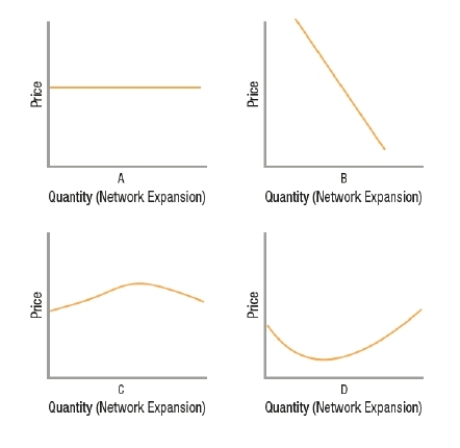
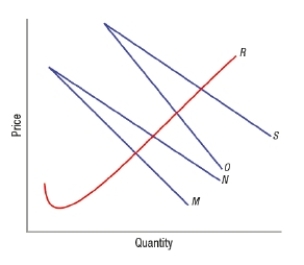
(Figure: Network Market Curves) Based on the graphs, which curve represents the demand curve for a network good?
(Multiple Choice)
4.7/5  (40)
(40)
If Sandy joins Match.com, then the value of membership in Match.com _____ for Joanie, who is already a member, and _____ for Robert, who is considering joining.
(Multiple Choice)
5.0/5 (45)
Describe some of the common strategies used to protect network goods from entering a vicious cycle or to increase the likelihood of entering a virtuous cycle.
(Essay)
4.8/5 (30)
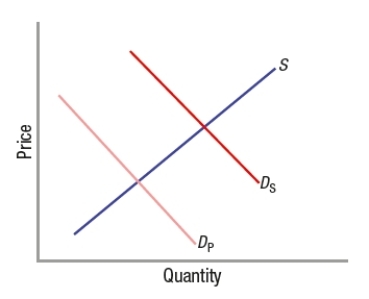
In the market for a network good, the private supply curve lies to the right of the social supply curve.
(True/False)
4.8/5 (31)
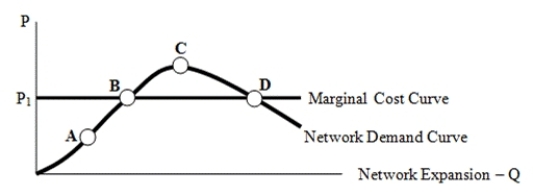
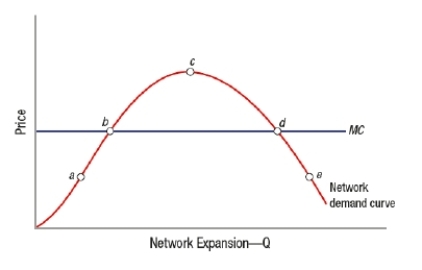
The equilibrium point on the following network demand curve occurs at point
(Multiple Choice)
4.7/5 (39)
Inputs that are needed to produce a product or to allow a person to consume a product are known as
(Multiple Choice)
4.9/5 (35)
Achieving an industry standard for a network good generally leads to
(Multiple Choice)
4.8/5 (28)
A pricing strategy that involves differentiating a good by packaging it into multiple products for people with different needs is
(Multiple Choice)
4.8/5 (36)
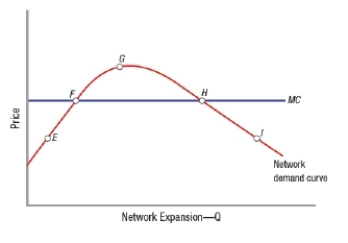
(Figure: Understanding Network Good Markets) The graph depicts the market for a network good. Which letter represents the social demand curve?
(Multiple Choice)
5.0/5 (26)
(Figure: Externalities and Network Effects) The graph depicts the market for a network good. Describe the effects, including shifts in supply and/or demand and changes in quantity, of a consumer leaving this network.
(Essay)
5.0/5 (36)
Network goods differ from other types of markets studied in economics because the supply curve is different.
(True/False)
4.8/5 (40)
Cable customers often purchase ESPN, whether they are sports fans or not. This is best described as an example of bundling.
(True/False)
4.8/5 (48)
A network good is one with which the benefit to the user rises if there is a small number of other users of the good.
(True/False)
4.9/5 (44)
(Figure: Market Equilibrium for a Network Good) Based on the graph, product maturity occurs at point
(Multiple Choice)
4.9/5 (32)
(Figure: Market for a Network Good 2) The graph depicts the market for a network good. What point represents the tipping point?
(Multiple Choice)
4.8/5 (39)
Equilibrium for a network good is at the intersection of the downward-sloping portion of the network demand curve and the marginal cost curve.
(True/False)
5.0/5 (37)
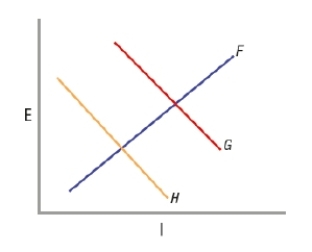
(Figure: Peak-Load Pricing Model) The graph represents the market for a good that follows a peak-load pricing model. Which curve represents demand during a nonpeak period?
(Multiple Choice)
4.9/5 (32)
Filters
- Essay(0)
- Multiple Choice(0)
- Short Answer(0)
- True False(0)
- Matching(0)