Exam 14: Quantitative Data Analysis
Exam 1: Science, Society, and Social Work Research30 Questions
Exam 2: The Process of Social Work Research19 Questions
Exam 3: Ethical and Scientific Guidelines for Social Work Research49 Questions
Exam 4: Measurement31 Questions
Exam 5: Sampling30 Questions
Exam 6: Causation and Research Design30 Questions
Exam 7: Group Experimental Designs43 Questions
Exam 8: Single-Subject Design60 Questions
Exam 9: Survey Research33 Questions
Exam 10: Qualitative Methods35 Questions
Exam 11: Qualitative Data Analysis27 Questions
Exam 12: Secondary Data Analysis and Mixed Methods38 Questions
Exam 13: Evaluation Research66 Questions
Exam 14: Quantitative Data Analysis47 Questions
Exam 15: Reporting Research56 Questions
Select questions type
A scatterplot is used to display the relationship between ____ continuous variables.
Free
(Multiple Choice)
4.9/5  (33)
(33)
Correct Answer: Verified
D
Match the concept with the definition.
-Cell
Free
(Multiple Choice)
4.8/5 (26)
Correct Answer:Verified
E
A Type ___ error is influenced by the effect of the intervention or the strength of the relationship between an independent variable and a dependent variable.
Free
(Multiple Choice)
4.8/5 (26)
Correct Answer:Verified
A
The median in a frequency distribution is determined by identifying the value corresponding to a cumulative percentage of 50.
(True/False)
4.8/5 (37)
Quiz scores: 25, 23, 22, 17, 46, 42, 105. What is the mean score?
(Multiple Choice)
4.9/5 (26)
The mode is the only appropriate measure of central tendency for nominal variables.
(True/False)
4.8/5 (37)
In a normal distribution, about 68 percent of all cases will fall between plus or minus one standard deviations from the mean.
(True/False)
4.9/5 (43)
Match the cross-tabulation concept with the definition.
-Existence
(Multiple Choice)
4.7/5 (43)
Why is it important to assign a unique identifying number to each respondent?
(Essay)
4.8/5 (36)
Match the cross-tabulation concept with the definition.
-Strength
(Multiple Choice)
4.8/5 (28)
For questions refer to the following table: Drug use by educational level
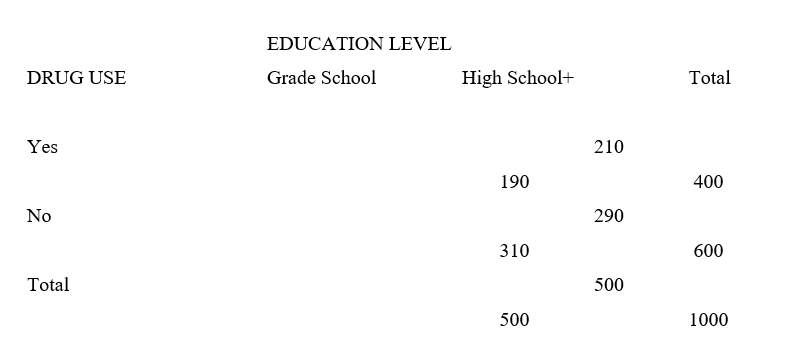 -In this table, how many persons with at least a high school education use drugs?
(Multiple Choice)
4.9/5 (41)
What are the problems that occur when comparisons are made across ethnic groups?
(Essay)
4.9/5 (32)
To determine the approiateness of a particular statistic it is imporant to know which one of the following?
(Multiple Choice)
4.8/5 (27)
Filters
- Essay(0)
- Multiple Choice(0)
- Short Answer(0)
- True False(0)
- Matching(0)