Exam 5: An Introduction to Macroeconomics
Exam 1: What Is Economics?227 Questions
Exam 2: The Economy: Myth and Reality150 Questions
Exam 3: The Fundamental Economic Problem: Scarcity and Choice250 Questions
Exam 4: Supply and Demand: An Initial Look308 Questions
Exam 5: An Introduction to Macroeconomics211 Questions
Exam 6: The Goals of Macroeconomic Policy207 Questions
Exam 7: Economic Growth: Theory and Policy223 Questions
Exam 8: Aggregate Demand and the Powerful Consumer214 Questions
Exam 9: Demand-Side Equilibrium: Unemployment or Inflation?211 Questions
Exam 10: Bringing in the Supply Side: Unemployment and Inflation?223 Questions
Exam 11: Managing Aggregate Demand: Fiscal Policy205 Questions
Exam 12: Money and the Banking System219 Questions
Exam 13: Monetary Policy: Conventional and Unconventional205 Questions
Exam 14: The Financial Crisis and the Great Recession61 Questions
Exam 15: The Debate over Monetary and Fiscal Policy214 Questions
Exam 16: Budget Deficits in the Short and Long Run210 Questions
Exam 17: The Trade Off between Inflation and Unemployment214 Questions
Exam 18: International Trade and Comparative Advantage226 Questions
Exam 19: The International Monetary System: Order or Disorder?213 Questions
Exam 20: Exchange Rates and the Macroeconomy214 Questions
Select questions type
Gross Domestic Product includes the sale of intermediate goods and services.
Free
(True/False)
4.8/5  (29)
(29)
Correct Answer: Verified
False
What are intermediate goods? Why do economists exclude the value of intermediate goods while calculating national income?
Free
(Essay)
4.9/5 (32)
Correct Answer:Verified
Intermediate goods are goods used as inputs in the production of other goods.There would be a problem of multiple counting if we include the value of both intermediate goods and final goods.For example,if chips sold to computer manufacturers were included in GDP,we would count the same chip when it was sold to the computer maker and then again as a component of the computer when it was sold to a consumer.Only final goods and services count in the GDP.
The price controls on consumer goods during World War II led to
Free
(Multiple Choice)
4.8/5 (36)
Correct Answer:Verified
C
Suppose that in 2011 you paid $150,000 for a house that was built in 2005 and sold that year for $210,000.The amount this transaction would add to the GDP in 2011 is
(Multiple Choice)
4.8/5 (25)
Cars produced by General Motors in Mexico would be included in U.S.Gross Domestic Product.
(True/False)
4.9/5 (33)
Since the end of World War II,the economy of the United States has been more influenced by stabilization policy.One of the undesirable side effects of this has been that the economy now has a greater tendency to suffer from
(Multiple Choice)
4.9/5 (39)
The Great Depression of the 1930s led to a revolution in macroeconomic thinking,following the work of
(Multiple Choice)
4.9/5 (39)
Which of the following would tend to increase the value of officially measured GDP?
(Multiple Choice)
4.8/5 (38)
Contrast the economic performance of the American economy of 2001 with the economic performance of the 1996 to 2001 period.Use the appropriate aggregate demand and aggregate supply curves to distinguish the differing economic condition of the two periods.
(Essay)
4.8/5 (32)
Macroeconomists pay little attention to the composition of aggregate output.
(True/False)
4.9/5 (32)
Dissatisfaction with public school education has led many parents to try home schooling for their children.If parents cut back on their jobs outside the home in order to spend time teaching their children at home,how will this affect GDP?
(Multiple Choice)
4.8/5 (35)
The aggregate demand curve shows the quantity of domestic product
(Multiple Choice)
4.8/5 (34)
You can generally distinguish an aggregate supply-caused recession from an aggregate demand-caused recession because
(Multiple Choice)
4.8/5 (35)
Aggregate demand and supply curves have been widely used to analyze the performance of the macroeconomy. Figure 5-3 shows four diagrams that represent different changes in the macroeconomy. Choose the diagram that best represents the situations described in the following questions.
Figure 5-3
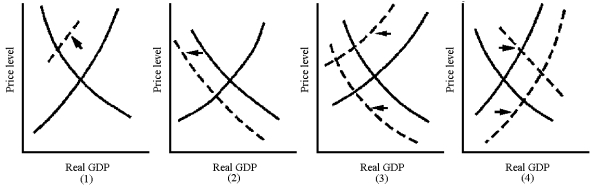 -Which graph in Figure 5-3 best represents the supply-side shock of the 1970s oil crisis?
(Multiple Choice)
4.7/5 (34)
GDP in 2011 would not include the resale of a house built in 2000.
(True/False)
4.9/5 (38)
Filters
- Essay(0)
- Multiple Choice(0)
- Short Answer(0)
- True False(0)
- Matching(0)