Exam 5: An Introduction to Macroeconomics
Exam 1: What Is Economics?227 Questions
Exam 2: The Economy: Myth and Reality150 Questions
Exam 3: The Fundamental Economic Problem: Scarcity and Choice250 Questions
Exam 4: Supply and Demand: An Initial Look308 Questions
Exam 5: An Introduction to Macroeconomics211 Questions
Exam 6: The Goals of Macroeconomic Policy207 Questions
Exam 7: Economic Growth: Theory and Policy223 Questions
Exam 8: Aggregate Demand and the Powerful Consumer214 Questions
Exam 9: Demand-Side Equilibrium: Unemployment or Inflation?211 Questions
Exam 10: Bringing in the Supply Side: Unemployment and Inflation?223 Questions
Exam 11: Managing Aggregate Demand: Fiscal Policy205 Questions
Exam 12: Money and the Banking System219 Questions
Exam 13: Monetary Policy: Conventional and Unconventional205 Questions
Exam 14: The Financial Crisis and the Great Recession61 Questions
Exam 15: The Debate over Monetary and Fiscal Policy214 Questions
Exam 16: Budget Deficits in the Short and Long Run210 Questions
Exam 17: The Trade Off between Inflation and Unemployment214 Questions
Exam 18: International Trade and Comparative Advantage226 Questions
Exam 19: The International Monetary System: Order or Disorder?213 Questions
Exam 20: Exchange Rates and the Macroeconomy214 Questions
Select questions type
Part of the good economic performance of the United States in the 1990s can be explained by a rightward-shifting aggregate supply curve.
(True/False)
4.7/5  (39)
(39)
Stabilization policy is the name given to government economic policies designed to
(Multiple Choice)
4.8/5 (28)
From the end of World War II until the present,the price level has
(Multiple Choice)
4.8/5 (31)
China is the world's largest wheat producer.If China's domestic product grew by eleven percent in the previous year,it implies that
(Multiple Choice)
5.0/5 (30)
A rightward shift in the aggregate demand curve is most likely to result in
(Multiple Choice)
4.8/5 (31)
In 1981,the Reagan administration employed a policy that included tax ____ while at the same time the Federal Reserve's strategy was to combat ____.
(Multiple Choice)
4.7/5 (31)
The most severe depression in the United States was the 30 percent decrease in real GDP that occurred between
(Multiple Choice)
5.0/5 (42)
Since countries differ in the amount of economic activity that is transacted in organized markets,
(Multiple Choice)
4.8/5 (30)
In the United States during the period from 1870 to 1940,the price level was most likely to
(Multiple Choice)
4.9/5 (48)
The worst post-World War II recession in the United States occurred in
(Multiple Choice)
4.7/5 (27)
A real estate salesperson sells a house in 2011 that was built in 2005.How does this transaction get counted in the GDP statistics?
(Multiple Choice)
4.7/5 (35)
What is an aggregate? How is it used in macroeconomics? Give two examples of specific aggregates that are used in the study of macroeconomics.
(Essay)
4.7/5 (29)
During the Great Depression of the 1930s,how much did output fall between 1929 and 1933?
(Multiple Choice)
4.8/5 (35)
Figure 5-1
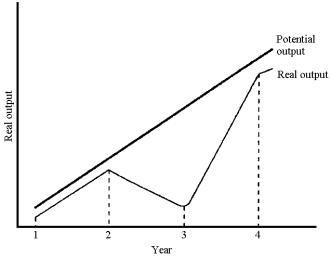 -Figure 5-1 plots potential and real output for a hypothetical economy.Based on this graph,the recession occurred
(Multiple Choice)
4.8/5 (34)
Figure 5-2
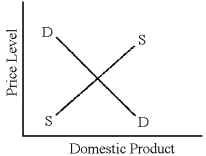 -In Figure 5-2,if the aggregate demand curve shifts outward over time,the economy will
(Multiple Choice)
4.7/5 (39)
In macroeconomics,the vertical axis in a supply-demand model measures the price level rather than a particular product's price.
(True/False)
4.8/5 (33)
Filters
- Essay(0)
- Multiple Choice(0)
- Short Answer(0)
- True False(0)
- Matching(0)