Exam 11: Managing Aggregate Demand: Fiscal Policy
Exam 1: What Is Economics?227 Questions
Exam 2: The Economy: Myth and Reality150 Questions
Exam 3: The Fundamental Economic Problem: Scarcity and Choice250 Questions
Exam 4: Supply and Demand: An Initial Look308 Questions
Exam 5: An Introduction to Macroeconomics211 Questions
Exam 6: The Goals of Macroeconomic Policy207 Questions
Exam 7: Economic Growth: Theory and Policy223 Questions
Exam 8: Aggregate Demand and the Powerful Consumer214 Questions
Exam 9: Demand-Side Equilibrium: Unemployment or Inflation?211 Questions
Exam 10: Bringing in the Supply Side: Unemployment and Inflation?223 Questions
Exam 11: Managing Aggregate Demand: Fiscal Policy205 Questions
Exam 12: Money and the Banking System219 Questions
Exam 13: Monetary Policy: Conventional and Unconventional205 Questions
Exam 14: The Financial Crisis and the Great Recession61 Questions
Exam 15: The Debate over Monetary and Fiscal Policy214 Questions
Exam 16: Budget Deficits in the Short and Long Run210 Questions
Exam 17: The Trade Off between Inflation and Unemployment214 Questions
Exam 18: International Trade and Comparative Advantage226 Questions
Exam 19: The International Monetary System: Order or Disorder?213 Questions
Exam 20: Exchange Rates and the Macroeconomy214 Questions
Select questions type
In an effort to balance the federal budget,an increase in Social Security taxes is passed.What is the most likely effect of this on equilibrium GDP?
Free
(Multiple Choice)
4.8/5  (28)
(28)
Correct Answer: Verified
B
Liberals tend to favor increasing taxes as the method of counteracting inflation.
Free
(True/False)
4.8/5 (37)
Correct Answer:Verified
True
What is the difference between tax cuts imposed on higher-income households compared with lower- and middle-income households? Discuss the implications for the multiplier and the effectiveness of the tax cuts for boosting GDP.
Free
(Essay)
4.7/5 (36)
Correct Answer:Verified
Higher-income households tend to save a higher fraction of their incomes than lower- and middle-income households.That is,high-income households have a lower MPC.This means that they have a lower multiplier.When the government reduces taxes for all Americans,high-income households save a higher portion of their tax cut than do low- and middle-income households.For a tax cut to affect GDP,households have to spend the tax cut on goods and services.If households save most of the tax cut,then GDP will not increase by as much.However,if the tax cut were targeted toward households that spend most of their income,the effects on GDP would be larger.
Supply-side policy is based on the assumption that people's economic behavior is not affected by taxes.
(True/False)
4.8/5 (27)
To eliminate an inflationary gap,the expenditure schedule should
(Multiple Choice)
4.8/5 (24)
The macroeconomic policy planner's job is made difficult because of
(Multiple Choice)
4.7/5 (28)
During the period from 2001 to 2006,there were several major cuts in personal income tax rates.What effect did these have on the value of the multiplier?
(Multiple Choice)
4.7/5 (33)
Table 11-1
 -Refer to Table 11-1.What is the level of saving in this model?
(Multiple Choice)
4.9/5 (31)
The president wishes to increase spending for education by $4 billion but also maintain a balanced budget.Therefore,taxes will also be increased by $4 billion.What will happen to GDP?
(Multiple Choice)
4.8/5 (41)
The fiscal policy planner's job is made easier because full-employment GDP can be accurately measured.
(True/False)
4.9/5 (35)
Figure 11-1
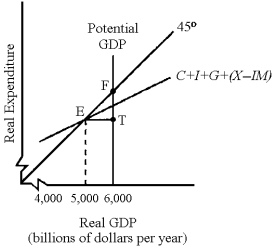 -In Figure 11-1,to achieve equilibrium at potential GDP the government could
(Multiple Choice)
5.0/5 (41)
Supply-side tax cuts designed to increase investment spending are attractive in theory,but in practice
(Multiple Choice)
4.8/5 (38)
Table 11-1
-Refer to Table 11-1.What is the level of tax revenues in this model?
(Multiple Choice)
4.9/5 (36)
In an effort to balance the budget,the government cuts spending rather than increasing taxes.What will happen to the consumption schedule?
(Multiple Choice)
4.8/5 (28)
Figure 11-2
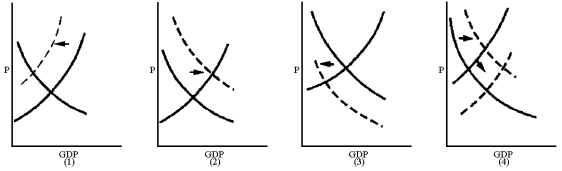 -Which graph in Figure 11-2 best reflects a Keynesian's view of the short-run impact of an increase in the personal income tax rate?
(Multiple Choice)
4.8/5 (38)
Figure 11-3
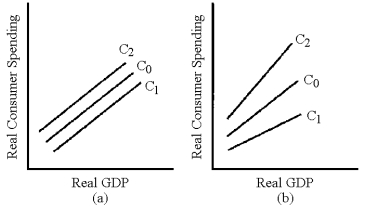 -In Figure 11-3,which line represents the change in the consumption schedule caused by a cut in fixed taxes?
(Multiple Choice)
4.9/5 (28)
As a general rule,when an income tax is added to the basic macroeconomic model,what happens to the consumption schedule?
(Multiple Choice)
4.9/5 (28)
Filters
- Essay(0)
- Multiple Choice(0)
- Short Answer(0)
- True False(0)
- Matching(0)