Exam 8: Macroeconomic Equilibrium: Aggregate Demand and Supply
Exam 1: The Wealth of Nations: Ownership and Economic Freedom87 Questions
Exam 2: Scarcity and Opportunity Costs87 Questions
Exam 3: The Market and Price System96 Questions
Exam 4: The Aggregate Economy61 Questions
Exam 5: National Income Accounting104 Questions
Exam 6: An Introduction to the Foreign Exchapterange Market and the Balance of Payments99 Questions
Exam 7: Unemployment and Inflation129 Questions
Exam 8: Macroeconomic Equilibrium: Aggregate Demand and Supply122 Questions
Exam 9: Aggregate Expenditures120 Questions
Exam 10: Income and Expenditures Equilibrium134 Questions
Exam 11: Fiscal Policy94 Questions
Exam 12: Money and Banking125 Questions
Exam 13: Monetary Policy141 Questions
Exam 14: Macroeconomic Policy: Tradeoffs, Expectations, Credibility, and Sources of Business Cycles117 Questions
Exam 15: Macroeconomic Viewpoints: New Keynesian, Monetarist, and New Classical103 Questions
Exam 16: Economic Growth95 Questions
Exam 17: Development Economics105 Questions
Exam 18: Globalization85 Questions
Exam 19: World Trade Equilibrium112 Questions
Exam 20: International Trade Restrictions109 Questions
Exam 21: Exchapterange Rates and Financial Links Between Countries132 Questions
Select questions type
The figure given below represents the equilibrium real GDP and price level in the aggregate demand and aggregate supply model.?Figure 8.3
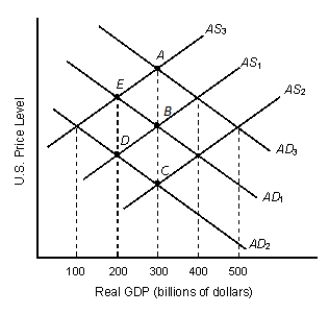 -Refer to Figure 8.3. If AS₁ and AD₁ represent the initial aggregate demand and supply in the economy, the long-run equilibrium real GDP will be _____ billion.
(Multiple Choice)
4.8/5  (33)
(33)
When the actual inflation rate rises more rapidly than nominal wage rates, we would expect the short-run aggregate supply curve to shift to the right.
(True/False)
4.8/5 (38)
The _____ is the change in the purchasing power of assets that causes spending to change when the price level changes.
(Multiple Choice)
4.8/5 (32)
Government spending is set by the federal authorities in such a way that aggregate supply just equals aggregate spending.
(True/False)
4.8/5 (35)
The figure given below represents the long-run equilibrium in the aggregate demand and aggregate supply model.?Figure 8.2
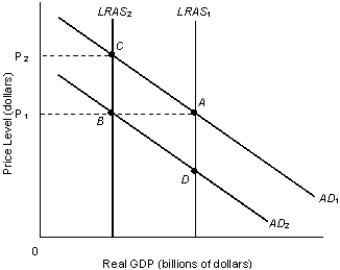 -Refer to Figure 8.2. Suppose major oil-exporting countries restrict oil output, thus increasing the price of oil. In the figure this would be represented by:
(Multiple Choice)
4.8/5 (34)
Assume that the aggregate demand increases while the short-run aggregate supply decreases. The result is a(n):
(Multiple Choice)
5.0/5 (29)
Which of the following is most likely to lead to an economic contraction?
(Multiple Choice)
4.8/5 (37)
Which of the following is an impact of an increase in the general price level?
(Multiple Choice)
4.8/5 (40)
In the short-run, an increase in the average price level in the economy will cause:
(Multiple Choice)
4.8/5 (35)
The change in aggregate expenditures resulting from a movement in the domestic price level, which in turn changes the price of domestic goods in relation to foreign goods, is known as the:
(Multiple Choice)
4.8/5 (24)
As the general price level in the country of Norweinshire rose, the average interest rate in the economy increased, thereby lowering aggregate expenditure. This relationship between price level, interest rate, and aggregate expenditure is referred to as the:
(Multiple Choice)
4.9/5 (37)
Other things equal, an increase in aggregate supply will cause:
(Multiple Choice)
4.8/5 (38)
Suppose an increase in investment spending results in an increase in equilibrium real GDP and a rise in the equilibrium price level. This implies that the aggregate supply curve for this economy is vertical.
(True/False)
4.9/5 (44)
An increase in the real value of assets is associated with a reduction in planned aggregate expenditures.
(True/False)
4.8/5 (34)
The aggregate supply curve shows the negative relationship between general price level and real GDP.
(True/False)
4.8/5 (26)
If the exchange rate is defined as the price of the foreign currency in terms of the domestic currency, an increase in the exchange rate:
(Multiple Choice)
5.0/5 (41)
The figure given below represents the equilibrium real GDP and price level in the aggregate demand and aggregate supply model.?Figure 8.3
-In Figure 8.3, which of the following shifts would result in stagflation (economic stagnation and inflation)?
(Multiple Choice)
4.7/5 (37)
The purchase of fifty new food-processing machines by the Campbell Soup Corporation would be classified as investment spending.
(True/False)
4.9/5 (38)
Given that energy is an input in production, the development of a cheaper source of energy will result in:
(Multiple Choice)
4.9/5 (33)
Which of the following is true of the disposable income of the households?
(Multiple Choice)
4.9/5 (33)
Filters
- Essay(0)
- Multiple Choice(0)
- Short Answer(0)
- True False(0)
- Matching(0)