Exam 2: Data Representation
Exam 1: Introduction9 Questions
Exam 2: Data Representation7 Questions
Exam 3: Univariate Population Parameters and Sample Statistics8 Questions
Exam 4: The Normal Distribution and Standard Scores5 Questions
Exam 5: Introduction to Probability and Sample Statistics4 Questions
Exam 6: Introduction to Hypothesis Testing: Inferences About a Single Mean7 Questions
Exam 7: Inferences About the Difference Between Two Means7 Questions
Exam 8: Inferences About Proportions6 Questions
Exam 9: Inferences About Variances8 Questions
Exam 10: Bivariate Measures of Association5 Questions
Exam 11: One-Factor Anova: Fixed-Effects Mode8 Questions
Exam 12: Multiple Comparison Procedures13 Questions
Exam 13: Factorial Anova: Fixed-Effects Mode16 Questions
Exam 14: One Factor Fixed-Effects Ancova With Single Covariate19 Questions
Exam 15: Random- and Mixed-Effects Analysis of Variance Models7 Questions
Exam 16: Hierarchical and Randomized Block Analysis of Variance Models12 Questions
Exam 17: Simple Linear Regression8 Questions
Exam 18: Multiple Linear Regression10 Questions
Exam 19: Logistic Regression15 Questions
Exam 20: Mediation and Moderation33 Questions
Select questions type
Of 100 research participants, 10 are in group A, 22 in group B, 30 in group C, and 38 in group D. What is the relative frequency for participants in group D?
Free
(Multiple Choice)
4.9/5  (41)
(41)
Correct Answer: Verified
D
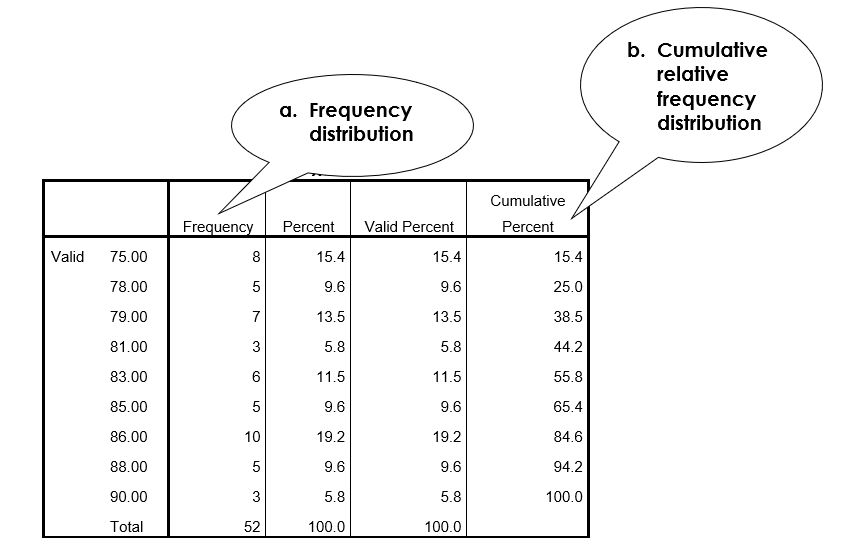
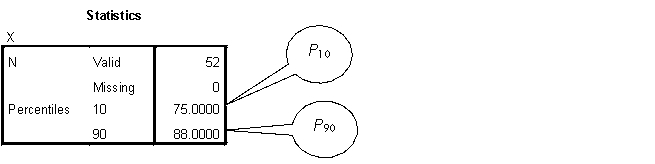
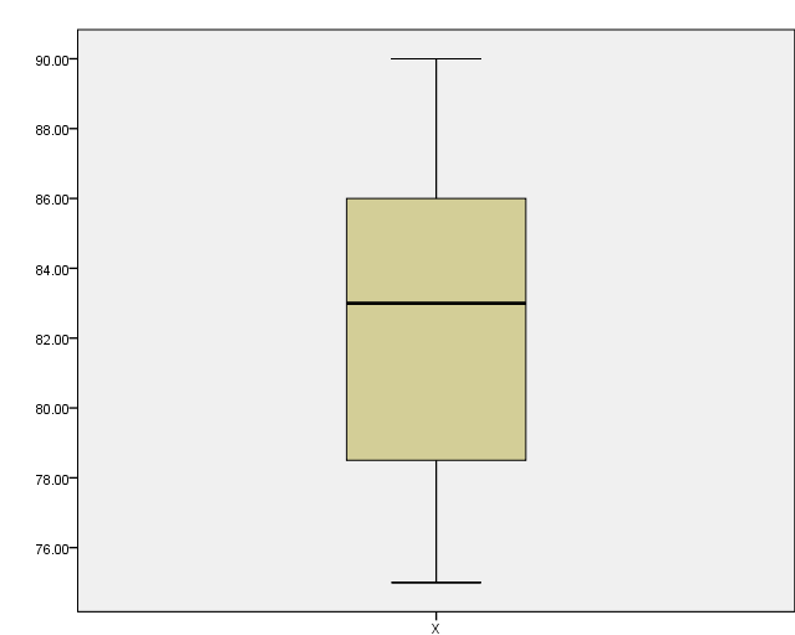
A sample distribution of variable X is as follows:
X f 75 8 78 5 79 7 81 3 83 6 85 5 86 10 88 5 90 3
Calculate or draw each of the following for the sample distribution of X. Where possible, use SPSS to generate the data.
a. Frequency distribution
b. Cumulative relative frequency distribution
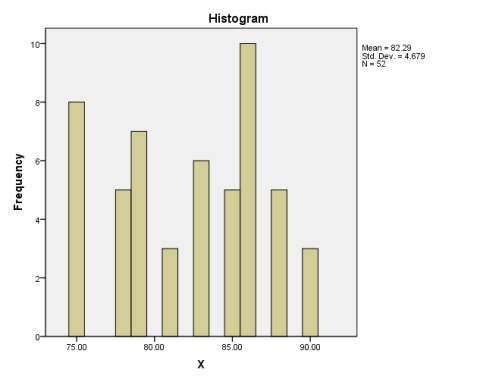
c. Histogram (ungrouped)
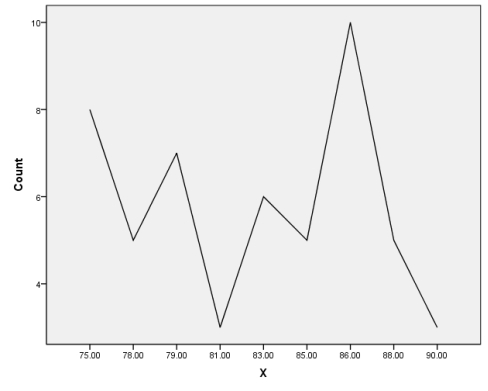
d. Frequency polygon
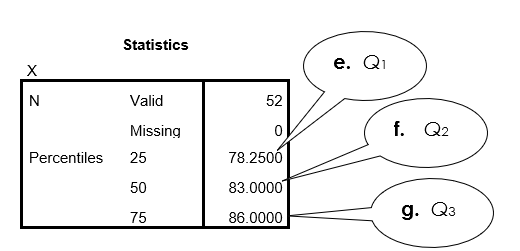
e. Q1
f. Q2
g. Q3
h. P10 and P90
i. Box-and-whisker plot
Free
(Essay)
4.9/5 (31)
Correct Answer:Verified
c. histogram (ungrouped)
d. frequency polygon
h. P10 and P90
i. box-and-whisker plot
In examining data collected over the past ten years, researchers at Sea World find that of 1,000 first-time guests: 452 visited during the summer months; 231 visited during the fall; 104 visited during the winter; and 213 visited during the spring. What is the relative frequency for guests who visited during the spring?
Free
(Multiple Choice)
4.9/5 (30)
Correct Answer:Verified
C
A sample distribution of variable X is as follows:
X f 2 2 5 5 6 8 8 3 10 4 12 6 15 1 18 5 20 7
Calculate or draw each of the following for the sample distribution of X. Where possible, Use SPSS to generate the data.
a. Frequency distribution
b. Cumulative relative frequency distribution
c. Histogram (ungrouped)
d. Frequency polygon
e. Q1
f. Q2
g. Q3
h. P10 and P90
i. Box-and-whisker plot
(Essay)
4.7/5 (35)
A sample distribution of variable X is as follows:
X f 15 5 20 3 24 1 28 4 32 2 34 7 36 3 38 8 40 4
Calculate or draw each of the following for the sample distribution of X. Where possible, use SPSS to generate the data.
a. Frequency distribution
b. Cumulative relative frequency distribution
c. Histogram (ungrouped)
d. Frequency polygon
e. Q1
f. Q2
g. Q3
h. P10 and P90
i. Box-and-whisker plot
(Essay)
5.0/5 (37)
Among the following, what is the preferred method for graphing data pertaining to favorite types of dance of a sample?
(Multiple Choice)
4.8/5 (36)
A sample distribution of variable X is as follows:
X f 100 4 110 8 115 2 120 6 125 10 130 5 135 7 140 3 145 1
Calculate or draw each of the following for the sample distribution of X. Where possible, use SPSS to generate the data.
a. Frequency distribution
b. Cumulative relative frequency distribution
c. histogram (ungrouped)
d. Frequency polygon
e. Q1
f. Q2
g. Q3
h. P10 and P90
i. Box-and-whisker plot
(Essay)
4.9/5 (30)
Filters
- Essay(0)
- Multiple Choice(0)
- Short Answer(0)
- True False(0)
- Matching(0)