Exam 2: Frequency Distributions.
Exam 1: Introduction to Statistics.83 Questions
Exam 2: Frequency Distributions.83 Questions
Exam 3: Central Tendency.88 Questions
Exam 4: Variability.85 Questions
Exam 5: z-Scores: Location of Scores and Standardized Distributions.86 Questions
Exam 6: Probability.84 Questions
Exam 7: Probability and Samples: The Distribution of Sample Means.84 Questions
Exam 8: Introduction to Hypothesis Testing.84 Questions
Exam 9: Introduction to the t Statistic85 Questions
Exam 10: The t Test for Two Independent Samples84 Questions
Exam 11: The t Test for Two Related Samples85 Questions
Exam 12: Introduction to Analysis of Variance84 Questions
Exam 13: Repeated-Measures and Two-Factor Analysis of Variance85 Questions
Exam 14: Correlation and Regression.85 Questions
Exam 15: The Chi-Square Statistic: Tests for Goodness of Fit and Independence84 Questions
Select questions type
For the following distribution of scores,?X = 18.
X 4 1 3 2 2 3 1 2
(True/False)
4.8/5  (42)
(42)
For the scores in the following table,what is the value of ?X²? \ X 4 1 3 2 2 1 1 3
(Multiple Choice)
4.9/5 (39)
For the following distribution of scores,?X² = 92.
X 4 1 3 2 2 3 1 2
(True/False)
4.7/5 (32)
A researcher surveys a sample of n = 200 college students and asks each person to identify his or her favorite movie from the past year.If the data were organized in a frequency distribution table,the first column would be a list of movies.
(True/False)
4.9/5 (35)
What kind of frequency distribution graph shows the frequencies as bars that are separated by spaces?
(Multiple Choice)
4.9/5 (39)
What is the shape of the distribution for the following set of data? Scores: 1,2,3,3,4,4,4 5,5,5,5,6
(Multiple Choice)
4.8/5 (34)
In February in New York,the daily high temperatures are typically low with only a few relatively warm days.A frequency distribution showing the daily high temperatures would probably form a negatively skewed distribution.
(True/False)
4.7/5 (28)
A sports historian recorded the number of times that the New York Yankees finished 1ˢᵗ,2ⁿᵈ,3ʳᵈ,and so on,in their division for the past 20 years.If the results are presented in a frequency distribution graph,then a histogram must be used.
(True/False)
4.8/5 (37)
If a set of exam scores forms a symmetrical distribution,what can you likely conclude about the students' scores?
(Multiple Choice)
4.8/5 (38)
In a positively skewed distribution,the scores pile up on the left side of the distribution and taper off to the right.
(True/False)
4.9/5 (36)
A biologist records the number of trout,bass,perch,and other types of fish caught in a local lake during a 2-week period.If the results are organized in a frequency distribution graph,what kind of graph should be used?
(Multiple Choice)
5.0/5 (27)
How many individual scores are in the following distribution? 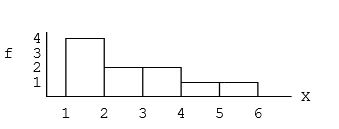
(Multiple Choice)
4.8/5 (40)
If the following distribution were shown in a histogram,the width of the bar above the 15-19 interval would reach from _____ to _____. X 20-24 2 15-19 5 10-14 4 5-9 1
(Multiple Choice)
4.9/5 (37)
In a distribution with positive skew,scores with the highest frequencies are _____.
(Multiple Choice)
4.8/5 (32)
For the following distribution,what is the highest score? 20-24 2 15-19 5 10-14 4 5-9 1
(Multiple Choice)
5.0/5 (41)
For the following distribution of scores,20% of the individuals have scores of X = 1.
X 5 2 4 8 3 5 2 3 1 2
(True/False)
4.7/5 (36)
For the following distribution of quiz scores,how many individuals had a score of X = 2? X f 5 6 4 5 3 5 2 3 1 2
(Multiple Choice)
5.0/5 (31)
A set of scores ranges from a low of X = 18 to a high of X = 98.If the scores are put in a grouped frequency distribution table with an interval width of 10 points,the bottom interval should be 10-19.
(True/False)
5.0/5 (32)
After recording the final grade (A,B,C,D,F)for each individual in a class of N = 26 students,the professor would like to display the grade distribution in a frequency distribution graph.What kind of graph should be used?
(Multiple Choice)
4.8/5 (37)
In a grouped frequency distribution,one interval is listed as 50-59.Assuming that the scores are measuring a continuous variable,what are the real limits for this interval?
(Multiple Choice)
4.9/5 (38)
Filters
- Essay(0)
- Multiple Choice(0)
- Short Answer(0)
- True False(0)
- Matching(0)