Exam 10: Explaining Aggregate Demand: the Is-Mp Model
Exam 1: Introduction to Macroeconomics and the Great Recession68 Questions
Exam 2: Measuring the Macroeconomy78 Questions
Exam 3: The Canadian Financial System83 Questions
Exam 4: Money and Inflation80 Questions
Exam 5: The Global Financial System and Exchange Rates81 Questions
Exam 6: The Labour Market77 Questions
Exam 7: The Standard of Living Over Time and Across Countries74 Questions
Exam 8: Long-Run Economic Growth85 Questions
Exam 9: Business Cycles92 Questions
Exam 10: Explaining Aggregate Demand: the Is-Mp Model94 Questions
Exam 11: The Is-Mp Model: Adding Inflation and the Open Economy74 Questions
Exam 12: Monetary Policy in the Short Run83 Questions
Exam 13: Fiscal Policy in the Short Run77 Questions
Exam 14: Aggregate Demand, aggregate Supply, and Monetary Policy75 Questions
Exam 15: Fiscal Policy and the Government Budget in the Long Run55 Questions
Exam 16: Consumption and Investment74 Questions
Select questions type
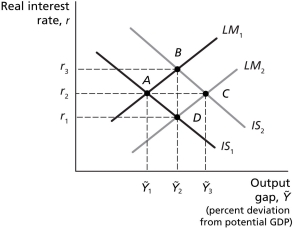
Figure 10.4
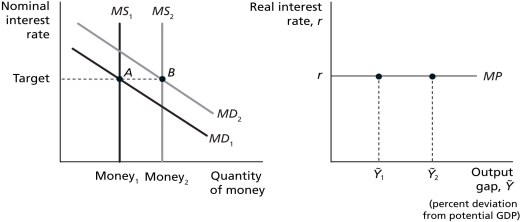 -Refer to Figure 10.4..Suppose the economy's equilibrium starts out with an output gap of ₁,and real GDP increases so the output gap increases to ₂.If the Bank of Canada wants to keep the interest rate at the target,the money demand curve will ________ and the money supply curve will ________.
Free
(Multiple Choice)
4.9/5  (26)
(26)
Correct Answer: Verified
A
Figure 10.5
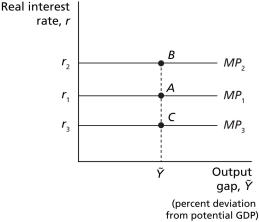 -Refer to Figure 10.5..A shift from MP₁ to MP₂ will occur if
Free
(Multiple Choice)
4.8/5 (37)
Correct Answer:Verified
D
Which of the following best represents the consumption function?
Free
(Multiple Choice)
4.9/5 (30)
Correct Answer:Verified
A
Figure 10.8
 -Refer to Figure 10.8..Other things equal,a decrease in the nominal money supply would best be represented by
(Multiple Choice)
4.8/5 (34)
Figure 10.3
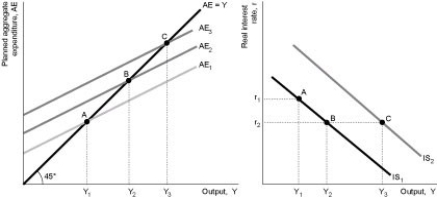 Panel (a) Panel (b)
-Refer to Figure 10.3..A decrease in the real interest rate,with no other changes that affect aggregate expenditure,is best represented by ________ in panel (a)and ________ in panel (b).
Panel (a) Panel (b)
-Refer to Figure 10.3..A decrease in the real interest rate,with no other changes that affect aggregate expenditure,is best represented by ________ in panel (a)and ________ in panel (b).
(Multiple Choice)
4.8/5 (33)
Using the IS-MP model,explain what happens to output and the real interest rate when the IS curve shifts to the right and when it shifts to the left,and when the MP curve shifts up and when it shifts down.
(Essay)
5.0/5 (34)
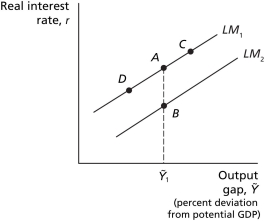
Figure 10.9
 -Refer to Figure 10.9..Other things equal,a decrease in the nominal money supply by the Bank of Canada is best represented as a change in equilibrium from
(Multiple Choice)
4.8/5 (34)
Figure 10.8
-Refer to Figure 10.8..Other things equal,an increase in the demand for money and the accompanying change in the real interest rate would best be represented by
(Multiple Choice)
4.7/5 (37)
Figure 10.5
-Refer to Figure 10.5..A shift from MP₁ to MP₂ will occur if
(Multiple Choice)
4.8/5 (33)
Holding other factors constant,a decline in incomes of Europeans will result in a ________ curve in Canada,reducing real GDP relative to potential GDP.
(Multiple Choice)
4.8/5 (33)
A positive demand shock causes a ________ the IS curve and a ________ the aggregate demand curve.
(Multiple Choice)
4.7/5 (30)
Changes in the real interest rate affect all of the following components of aggregate expenditure,except
(Multiple Choice)
4.9/5 (34)
Table 10.1
Consurmpticn C=\ 1.0+0.75 Irvestmernt =\ 1.9 Goverument purchases =\ 2 Net exports =-\ 0.5 Taxes =\ 0 Goverument trarssfer gayments =\ 0
(all values are in billions of dollars)
-Refer to Table 10.1.The value of the government purchases multiplier in this economy is
(Multiple Choice)
4.8/5 (34)
Figure 10.3
Panel (a) Panel (b)
-Refer to Figure 10.3..A positive demand shock accompanied by a decrease in the real interest rate is best represented by ________ in panel (a)and ________ in panel (b).
(Multiple Choice)
4.9/5 (35)
Assume the economy is in a recession and the federal government decides to cut personal income tax rates.All else equal,the cut in tax rates should
(Multiple Choice)
4.8/5 (27)
Figure 10.1
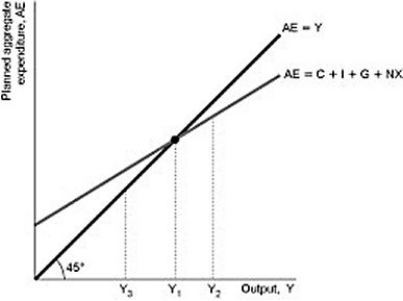 -Refer to Figure 10.1..If the level of real GDP is initially Y₃,firms will ________ production until equilibrium is reached at ________.
(Multiple Choice)
4.9/5 (33)
Assume that the economy is initially in equilibrium and the Bank of Canada keeps the nominal money supply constant.Construct a money market graph and an LM curve and use them to explain what happens if the economy experiences a negative demand shock.
(Essay)
4.8/5 (43)
If the MPC = 0.8,an increase in investment spending from $35 billion to $38 billion will increase real GDP by
(Multiple Choice)
4.8/5 (35)
The IS-MP model assumes the Bank of Canada targets ________,and the IS-LM model assumes the Bank of Canada targets ________.
(Multiple Choice)
4.8/5 (26)
A decrease in the price level causes a ________ the IS curve and a ________ the aggregate demand curve.
(Multiple Choice)
4.8/5 (24)
Filters
- Essay(0)
- Multiple Choice(0)
- Short Answer(0)
- True False(0)
- Matching(0)