Exam 6: Correlation and Regression
Exam 1: Introduction211 Questions
Exam 2: Exploring Data: Frequency Distributions and Graphs94 Questions
Exam 3: Exploring Data: Central Tendency103 Questions
Exam 4: Exploring Data: Variability137 Questions
Exam 5: Other Descriptive Statistics188 Questions
Exam 6: Correlation and Regression170 Questions
Exam 7: Theoretical Distributions Including the Normal Distribution138 Questions
Exam 8: Samples, Sampling Distributions, and Confidence Intervals162 Questions
Exam 9: Hypothesis Testing and Effect Size: One-Sample Designs157 Questions
Exam 10: Hypothesis Testing, Effect Size, and and Confidence Intervals: Two-Sample Designs206 Questions
Exam 11: Analysis of Variance: One-Way Classification176 Questions
Exam 12: Analysis of Variance: One-Factor Repeated Measures105 Questions
Exam 13: Analysis of Variance: Factorial Design148 Questions
Exam 14: Chi Square Tests147 Questions
Exam 15: More Nonparametric Tests150 Questions
Exam 16: Appendix: Grouped Frequency Distributions and Central Tendency21 Questions
Select questions type
The credit for working out the mathematics of correlation and regression goes to
(Multiple Choice)
4.9/5  (34)
(34)
Psychologists demonstrated that number of hour spent in class is correlated to grades in that class. The correlation between the number of hours in class and grades is
(Multiple Choice)
4.9/5 (37)
Suppose you had the exam scores on the first exam for 100 psychology students. A correlation coefficient could be calculated if the scores were divided according to
(Multiple Choice)
4.9/5 (40)
A person who believes in the philosophy of quantification believes
(Multiple Choice)
4.8/5 (36)
Interpret the meaning of the following statements:
a. There is a large negative correlation between the speed of the car at the time of the crash and the amount of damage.
b. There is a large negative correlation between the amount of time spent on the test and the number of correct responses.
c. There is a zero coefficient between degree of claustrophobia and age.
d. There is a positive correlation between the number of times a person has been married and his or her happiness.
(Essay)
4.8/5 (34)
An Introductory Psychology teacher wanted to know the relationship between course grades and course evaluation. He had all students in his Introductory Psychology sections complete a course evaluation. From these evaluations, he randomly selected the course evaluation of 15 students. He correlated their course-evaluation scores with their course grades, letting A = 5, B = 4, C = 3, D = 2, and F = 1. Here are his data. 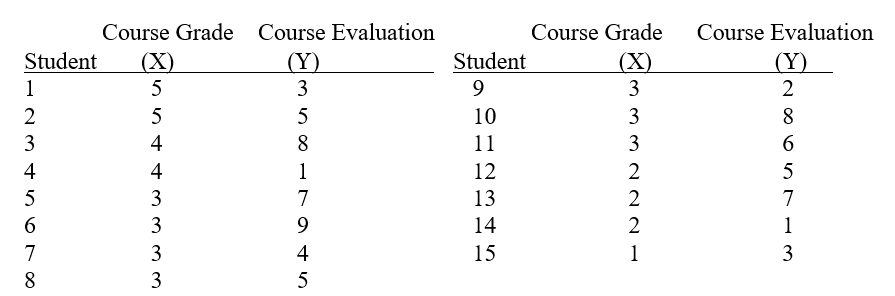 a. Compute r.
b. Interpret r.
a. Compute r.
b. Interpret r.
(Essay)
4.8/5 (38)
Pearson product-moment correlation coefficients can accurately describe the relationship between two variables when
(Multiple Choice)
4.8/5 (32)
In comparing a positive and a negative correlation coefficient of equal size, you can say that the positive one is
(Multiple Choice)
4.9/5 (48)
a.Find r for the z scores below. 1.3 1.2 -0.3 0.2 -1.2 -2.1 0.5 0.3 -0.6 -0.2 b. Compute the coefficient of determination for the data above.
(Essay)
4.8/5 (42)
Given the regression equation, = 6 + 0.5X, where X is a score on an attitude scale and is a job satisfaction score, what satisfaction score would be predicted for an attitude score of 10?
(Multiple Choice)
4.9/5 (42)
Five "natural" athletes were asked to participate in a study of motor skills. As part of the study they learned to balance on a freestanding ladder (a skill that requires you to make quick, precise adjustments) and to perform the two-hand coordination task (an eye-hand coordination task). The scores are shown below.Calculate a correlation coefficient and write a conclusion about motor skills in excellent athletes. Construct a scatterplot. Initials Ladder Coordination TH 8 1.7 IS 11 1.0 IS 3 1.2 TR 7 1.5 UE 9 0.6
(Essay)
4.8/5 (33)
To determine the percent of variance that two variables have in common, you need the
(Multiple Choice)
4.7/5 (30)
Your textbook said that truncating the range of a distribution increases the size of r.
(True/False)
4.9/5 (39)
An industrial psychologist constructed a test intended to predict on-the-job success of applicants for the position of widget inspector. In order to discover how well her test worked, she gave her new test to the first applicants for the job and hired them on probationary status regardless of their test scores. She then counted the number of faulty widgets approved by each applicant during their first week on the job. Below are the test scores and errors in approval for each applicant. Faulty Widgets 1 20 2 2 18 1 3 17 5 4 16 4 5 16 3 6 15 6 7 15 9 8 13 5 Faulty Widgets 9 13 12 10 13 8 11 12 10 12 11 7 13 9 14 14 6 17 15 4 22
a. How good is the test?
b. How many faulty widgets would you expect to be approved during the first week on the job by a person who scored 14 on the test?
(Essay)
4.8/5 (37)
Data Set 6-1
The correlation between the number of PhDs and the number of mules in a state used to be approximately -.90. Accept the following simplified summary data.
Mean 40 200 Standard Deviation 15 50
In questions based on Data Set 6-1, the task is to predict the number of mules for a state, given the number of PhDs.
-Look at Data Set 6-1. For a state with no PhDs the predicted number of mules is
(Multiple Choice)
4.9/5 (38)
According to your textbook, there is acorrelation between number of test takers in a room and motivation.
(Multiple Choice)
4.8/5 (33)
Filters
- Essay(0)
- Multiple Choice(0)
- Short Answer(0)
- True False(0)
- Matching(0)