Exam 2: Exploring Data: Frequency Distributions and Graphs
Exam 1: Introduction211 Questions
Exam 2: Exploring Data: Frequency Distributions and Graphs94 Questions
Exam 3: Exploring Data: Central Tendency103 Questions
Exam 4: Exploring Data: Variability137 Questions
Exam 5: Other Descriptive Statistics188 Questions
Exam 6: Correlation and Regression170 Questions
Exam 7: Theoretical Distributions Including the Normal Distribution138 Questions
Exam 8: Samples, Sampling Distributions, and Confidence Intervals162 Questions
Exam 9: Hypothesis Testing and Effect Size: One-Sample Designs157 Questions
Exam 10: Hypothesis Testing, Effect Size, and and Confidence Intervals: Two-Sample Designs206 Questions
Exam 11: Analysis of Variance: One-Way Classification176 Questions
Exam 12: Analysis of Variance: One-Factor Repeated Measures105 Questions
Exam 13: Analysis of Variance: Factorial Design148 Questions
Exam 14: Chi Square Tests147 Questions
Exam 15: More Nonparametric Tests150 Questions
Exam 16: Appendix: Grouped Frequency Distributions and Central Tendency21 Questions
Select questions type
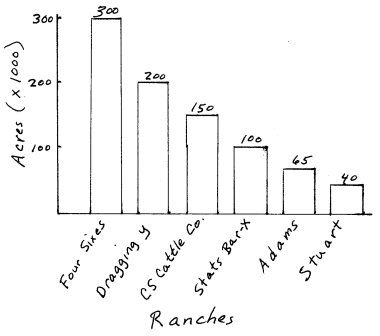
Among the legendary ranches in North America such as the Dragging y Cattle Ranch and the Four Sixes, some authors include the mythical Stats Bar-X Ranch, which has 100,000 acres. Using the data that follow, construct a graph. Naturally, a bar graph is called for. Stats Bar-X 100,000 Dragging y 200,000 Four Sixes 300,000 Adams Ranch, 65,000 CS Cattle Company 150,000 Stuart Ranch 40,000
Free
(Essay)
4.9/5  (42)
(42)
Correct Answer: Verified
The distribution not described in the text was the
Free
(Multiple Choice)
4.7/5 (31)
Correct Answer:Verified
B
A bar graph is used to present the frequencies of a quantitative variable.
Free
(True/False)
4.8/5 (45)
Correct Answer:Verified
False
A positively skewed curve has a thin point directed to the right side of a graph.
(True/False)
4.8/5 (46)
A frequency polygon and a bar graph can be used for the same frequency distribution.
(True/False)
4.8/5 (33)
Identify the skew of the two distributions below.
- X f 5 10 4 8 3 6 2 2 1 1 0 1
(Multiple Choice)
4.9/5 (43)
Describe the distinguishing characteristics of the histogram, line graph, and frequency polygon.
(Essay)
4.9/5 (40)
A bar graph is the proper graph for the frequency distribution of Satisfaction With Life Scale scores.
(True/False)
4.7/5 (34)
Assume you collect data from psychology majors who indicate their favorite class in psychology. Students choose from five classes. What kind of graph should you use to display the data?
(Multiple Choice)
4.7/5 (42)
A formal grouped frequency distribution is characterized by
(Multiple Choice)
4.9/5 (31)
Suppose a frequency distribution with a range of 0 to 100 was severely positively skewed. The greatest frequency of scores would be clustered near
(Multiple Choice)
4.9/5 (37)
Under what conditions would you choose to use a histogram rather than a bar graph?
(Short Answer)
4.9/5 (39)
To graph the relationship between years and the number of automobile accidents, use
(Multiple Choice)
4.8/5 (40)
If a set of scores ranged from 50 to 99 and the distribution was negatively skewed, you would expect to find the fewest scores in the interval
(Multiple Choice)
4.9/5 (38)
Simple frequency distributions have class intervals that cover two or more scores.
(True/False)
4.8/5 (45)
Graphs are used by scientists in the early stages of a project, even before data are collected
(True/False)
4.7/5 (50)
A positively skewed curve has a thin point directed to the left side of a graph.
(True/False)
4.8/5 (43)
Data Set 2-1
A student was interested in the structure of the families in the U.S. He sampled 29 of his 330 classmates and got the following answers to the question, "How many children are there in your family?"
3 , 1 , 2 , 2 , 4 , 2 , 1 , 2 , 2 , 1 , 3 , 2 , 3 , 3 , 4 , 2 , 2 , 1 , 3 , 5 , 1 , 1 , 3 , 5 , 2 , 4 , 7 , 1 , 2
-Referring to Data Set 2-1, the proper frequency distribution is:
(Multiple Choice)
4.9/5 (49)
Horizontal axis, X-axis, and ordinate are all names for the same line.
(True/False)
4.9/5 (33)
Filters
- Essay(0)
- Multiple Choice(0)
- Short Answer(0)
- True False(0)
- Matching(0)