Exam 11: Analysis of Variance: One-Way Classification
Exam 1: Introduction211 Questions
Exam 2: Exploring Data: Frequency Distributions and Graphs94 Questions
Exam 3: Exploring Data: Central Tendency103 Questions
Exam 4: Exploring Data: Variability137 Questions
Exam 5: Other Descriptive Statistics188 Questions
Exam 6: Correlation and Regression170 Questions
Exam 7: Theoretical Distributions Including the Normal Distribution138 Questions
Exam 8: Samples, Sampling Distributions, and Confidence Intervals162 Questions
Exam 9: Hypothesis Testing and Effect Size: One-Sample Designs157 Questions
Exam 10: Hypothesis Testing, Effect Size, and and Confidence Intervals: Two-Sample Designs206 Questions
Exam 11: Analysis of Variance: One-Way Classification176 Questions
Exam 12: Analysis of Variance: One-Factor Repeated Measures105 Questions
Exam 13: Analysis of Variance: Factorial Design148 Questions
Exam 14: Chi Square Tests147 Questions
Exam 15: More Nonparametric Tests150 Questions
Exam 16: Appendix: Grouped Frequency Distributions and Central Tendency21 Questions
Select questions type
The designs analyzed in Chapter 11 called for the samples to be
(Multiple Choice)
4.8/5  (37)
(37)
The actual amount of difference the independent variable makes is most closely associated with
(Multiple Choice)
4.9/5 (32)
The techniques of Chapter 11 are not appropriate if the data come from
(Multiple Choice)
4.8/5 (36)
Solomon Asch's experiments are classic in the social psychology area of conformity. Asch had under-graduate participants choose which of three lines matched a standard line. Each participant made 18 judgments in the presence of 1, 2, or 4 other "participants" (who announced their judgments first). These other "participants"were confederates of Asch who made incorrect judgments on 12 of the trials. The scores below give the number of times a participant conformed to the others by joining them with incorrect matches. Perform an ANOVA, compose a summary table, find f, and compare the two-and four-confederate conditions with a Tukey HSD and d. Tell the story of what your analysis shows. Number of confederates One Two Four 0 0 2 2 2 2 0 0 7 0 3 5 1 4 6 2 4 4
(Essay)
4.8/5 (39)
A group of 36 subjects was equally divided into 3 groups. A Tukey HSD produced a value that led to the conclusion that Mean 1 was significantly larger than Mean 2, p < .05. Which of the following situations would lead to such a conclusion?
(Multiple Choice)
4.9/5 (35)
To distribute the effect of extraneous variables equally among treatments, you should
(Multiple Choice)
4.8/5 (27)
MSerror is a good estimator of 2 when the null hypothesis is true.
(True/False)
4.8/5 (29)
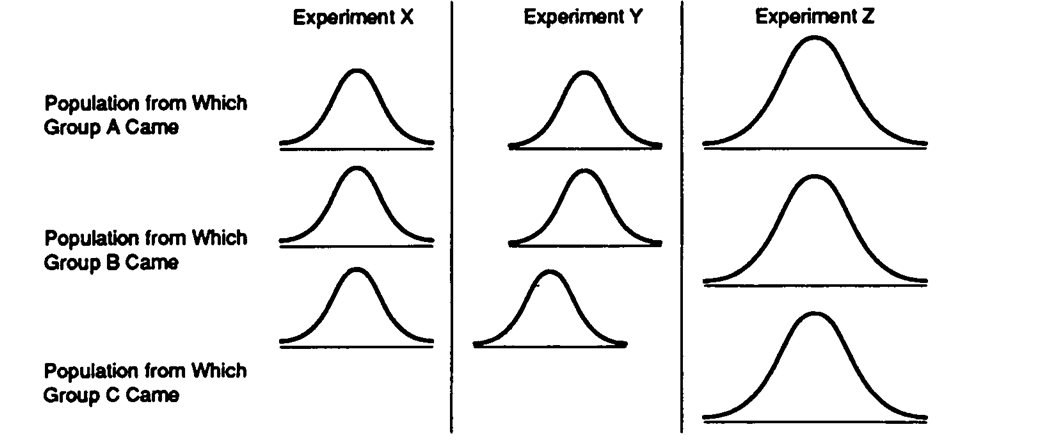
Data Set 11-4: The baseline of each curve represents scores on the dependent variable (just like the curves in the book).
 -Refer to Data Set 11-4. The denominator of the F ratio would be largest for an ANOVA in Experiment
(Multiple Choice)
4.8/5 (39)
The person responsible for developing analysis of variance was Karl Pearson.
(True/False)
4.9/5 (35)
A group of 52 participants was divided equally into 4 groups. A Tukey HSD produced a value that led to the conclusion that Mean 1 was significantly larger than Mean 2, p < .05. Which of the following situations would lead to such a conclusion?
(Multiple Choice)
5.0/5 (33)
After an ANOVA is calculated and the group means examined, a post hoc test is appropriate.
(True/False)
4.9/5 (32)
According to the data analyzed and interpreted by your text, the effect of different schedules of reinforcement is to produce different
(Multiple Choice)
4.9/5 (39)
Data Set 11-8: Group A Group B Group C 8 5 1 10 10 10 12 15 19
-Suppose you performed HSD tests on the means of the groups in Data Set 11-8. The HSD values would be
(Multiple Choice)
4.9/5 (41)
A sum of squares divided by degrees of freedom is a mean square.
(True/False)
4.9/5 (38)
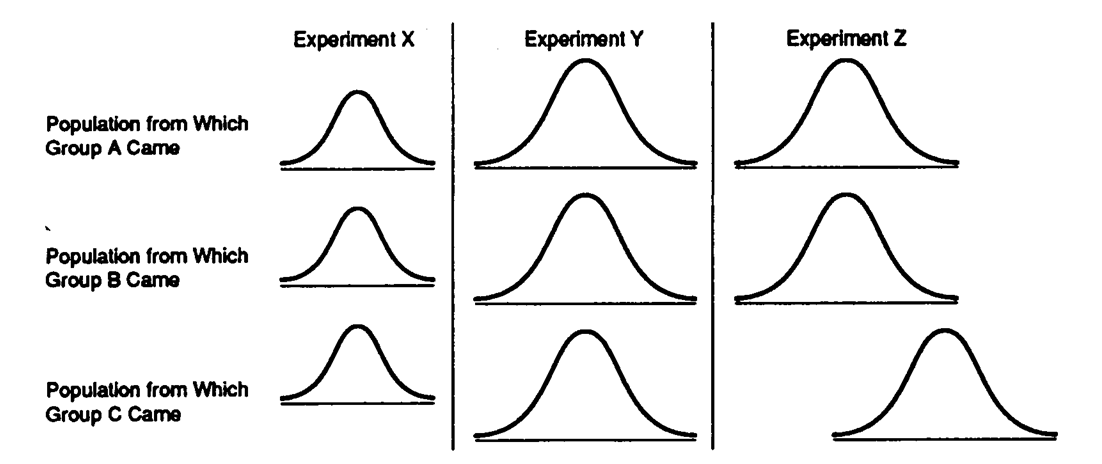
Data Set 11-1: The baseline of each curve represents scores on the dependent variable (just like the curves in the book).
 -Refer to Data Set 11-1. The null hypothesis is true in Experiment
(Multiple Choice)
4.8/5 (39)
Suppose the following F values were calculated from different experiments. If = .01, which of them would lead to rejection of the null hypothesis?
(Multiple Choice)
4.8/5 (33)
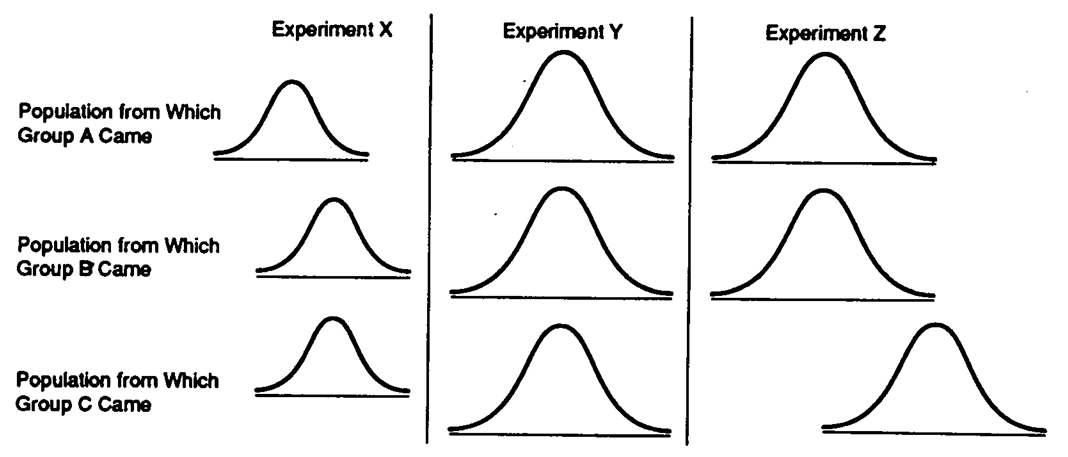
Data Set 11-2: The baseline of each curve represents scores on the dependent variable (just like the curves in the book).
 -Refer to Data Set 11-2. The null hypothesis should be rejected for an ANOVA on Experiment
(Multiple Choice)
4.9/5 (37)
Filters
- Essay(0)
- Multiple Choice(0)
- Short Answer(0)
- True False(0)
- Matching(0)