Exam 1: Limits, Alternatives, and Choices
Exam 1: Limits, Alternatives, and Choices21 Questions
Exam 2: The Market System and the Circular Flow11 Questions
Exam 3: Demand, Supply, and Market Equilibrium30 Questions
Exam 4: Elasticity of Demand and Supply23 Questions
Exam 5: Market Failures: Public Goods and Externalities12 Questions
Exam 6: Businesses and Their Costs15 Questions
Exam 7: Pure Competition6 Questions
Exam 8: Pure Monopoly17 Questions
Exam 9: Monopolistic Competition and Oligopoly16 Questions
Exam 10: GDP and Economic Growth39 Questions
Exam 11: Business Cycles, Unemployment, and Inflation40 Questions
Exam 12: Aggregate Demand and Aggregate Supply62 Questions
Exam 13: Fiscal Policy, Deficits, and Debt72 Questions
Exam 14: Money, Banking, and Financial Institutions58 Questions
Exam 15: Interest Rates and Monetary Policy69 Questions
Exam 16: International Trade and Exchange Rates28 Questions
Exam 17: Wage Determination17 Questions
Exam 18: Income Inequality and Poverty20 Questions
Select questions type
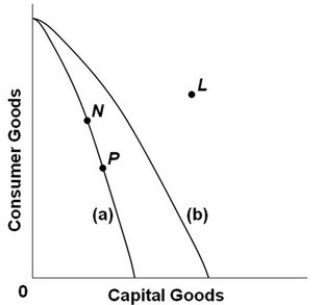 -Refer to the above production possibilities curves. Curve (a) is the current curve for the economy. The movement from curve (a) to curve (b) suggests:
Free
(Multiple Choice)
4.9/5  (31)
(31)
Correct Answer: Verified
B
The following economy produces two products.
 - Given the production possibilities schedule above, a combination of three tanks and 350 autos:
Free
(Multiple Choice)
4.7/5 (38)
Correct Answer:Verified
B
A point on the frontier of the production possibilities curve is:
Free
(Multiple Choice)
4.9/5 (46)
Correct Answer:Verified
A
When an economy is at full employment and full production, more of any one product:
(Multiple Choice)
4.9/5 (35)
If a consumer has an income of $120, the price of X is $5, and the price of Y is $8. Which combination of the two goods is unattainable?
(Multiple Choice)
4.8/5 (34)
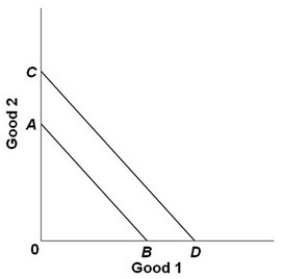 - In the diagram above, Cheri's budget line shifts outward from AB to CD. Which statement below is consistent with this shift?
(Multiple Choice)
4.8/5 (33)
A movement along the production possibilities curve would imply that:
(Multiple Choice)
4.9/5 (33)
Society wants to use its scarce resources efficiently. To achieve this economic goal it must:
(Multiple Choice)
4.8/5 (32)
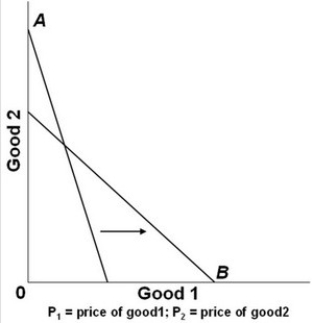 In the graph above, A is the initial budget line and B is the new budget line. Which of the following changes might have occurred?
(Multiple Choice)
4.9/5 (44)
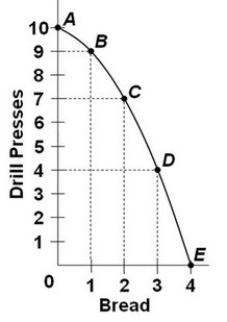 Refer to the graph. The combination of 4 units of drill presses and 2 units of bread is:
(Multiple Choice)
4.8/5 (25)
Suppose there are two economies, Alpha and Beta, which have the same production possibilities curves and are on the same point on each curve. If Beta then devotes more resources to investment goods than consumer goods when compared to Alpha, then in the future:
(Multiple Choice)
4.9/5 (34)
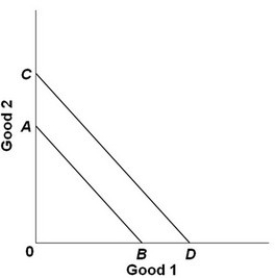 - Refer to the above graph. The shift of the budget line from AB to CD is consistent with:
(Multiple Choice)
4.9/5 (35)
Economics is the study of the efficient use of scarce resources to achieve maximum satisfaction of economic wants.
(True/False)
4.9/5 (33)
If an economy is producing at a point inside a production possibilities curve:
(Multiple Choice)
4.9/5 (38)
If an economy that produces capital and consumer goods is operating at a point on its production possibilities curve:
(Multiple Choice)
4.9/5 (46)
According to the Zuckerberg, Seacrest, and Swift illustration:
(Multiple Choice)
4.8/5 (36)
Assume that for Indy, one hour of study time in economics is perfectly substitutable for an hour of study time in calculus. Indy has exams in both subjects tomorrow and he determines that if he spends all of his time studying economics, he will receive scores of 96 on his economics exam and 45 on his calculus exam. If he studies only calculus, his economics score will be 81 and his calculus score will be 90. Based on this information and assuming that Indy has no better alternative use of his time, what is the opportunity cost of improving his economics score by one (1) point?
(Multiple Choice)
4.7/5 (29)
The following economy produces two products.
 -Refer to the above table. According to the production possibilities schedule, a combination of four tanks and 650 autos is:
(Multiple Choice)
4.7/5 (34)
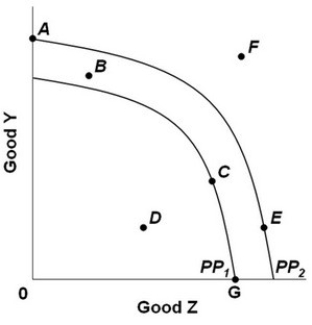 The graph above shows two production possibilities curves for a nation that produces two goods, Y and Z. PP1 and PP2 show the production possibilities for years 1 and 2. The nation's total production then decreased after year 2. This change could be represented by a move from:
(Multiple Choice)
4.9/5 (29)
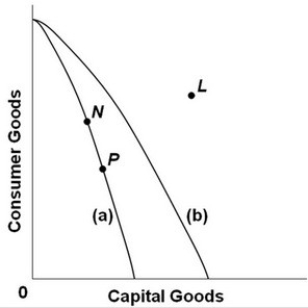 -Refer to the above production possibilities curves. Curve (a) is the current curve for the economy. Other things being equal, society's current choice of point P on curve (a) will:
(Multiple Choice)
4.9/5 (36)
Filters
- Essay(0)
- Multiple Choice(0)
- Short Answer(0)
- True False(0)
- Matching(0)