Exam 5: Probability and the Normal Curve
Exam 1: Concepts, Variables, and Measurement37 Questions
Exam 2: Frequency Tables32 Questions
Exam 3: Measures of Central Tendency39 Questions
Exam 4: Measures of Dispersion29 Questions
Exam 5: Probability and the Normal Curve29 Questions
Exam 6: Probabilityfrom Samples to Statistics31 Questions
Exam 7: Cross-Tabulation Tables and Chi-Square27 Questions
Exam 8: Measures of Association for Categorical Variables37 Questions
Exam 9: Analysis of Variance27 Questions
Exam 10: Correlation and Regression28 Questions
Select questions type
What do z-scores represent?
Free
(Short Answer)
4.9/5  (32)
(32)
Correct Answer: Verified
Z-scores represent the value of a particular case relative to the mean, measured in units of standard deviation. In other words, a z-score is the number of standard deviations between a case and the mean.
Relative frequency refers to the proportion of times that we observe an event occurring.
Free
(True/False)
4.7/5 (41)
Correct Answer:Verified
False
When calculating the probability of pulling one of ten names out of a hat, the denominator is the -------------.
Free
(Multiple Choice)
4.9/5 (32)
Correct Answer:Verified
B
Drawing a card from a deck, returning it, and then determining the probability of drawing the same card is an example of probability without replacement.
(True/False)
4.9/5 (40)
Use the following table to answer questions:
RACE OF RESPONDENT
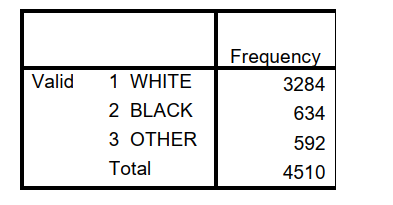 -What is the probability of consecutively selecting two white respondents?
(Multiple Choice)
4.8/5 (45)
The 2006 GSS asked respondents how many siblings they have. The mean number of siblings was 3.76 with a standard deviation of 3.178. Use this information to answer the following questions:
a. What number of siblings falls at the 50th percentile?
b.What is the z-score associated with a raw score of 2 siblings?
c.What is the z-score associated with a raw score of 6 siblings?
d.What is the probability of selecting arespondent with more than 10 siblings?
e.What is the probability of selecting eithera respondent with 2 or fewer siblings, or arespondent with more than 5?
f.What is the probability of a respondent having between 2 and 5 siblings?
(Short Answer)
4.8/5 (35)
Use the following table to answer questions:
RACE OF RESPONDENT
-What is the probability of selecting a respondent who is black?
(Multiple Choice)
4.8/5 (40)
Use the following table to answer questions:
RACE OF RESPONDENT
-What is the probability of selecting a respondent who is white?
(Multiple Choice)
4.8/5 (36)
Determining the probability in question 4 utilizes which of the following?
(Multiple Choice)
4.9/5 (41)
Suppose a hat contains slips of paper numbered 1-10. After selecting and setting aside numbers "4" and "7," what is the probability of pulling a "5" on your next attempt?
(Multiple Choice)
4.7/5 (39)
Use the following table to answer questions:
RACE OF RESPONDENT
-What is the probability of selecting a respondent identifying as either white or other?
(Multiple Choice)
4.9/5 (25)
If a hat contains slips of paper numbered 1-10, what is the probability of pulling a "5" on your first attempt?
(Multiple Choice)
4.9/5 (39)
When flipping a coin twice the second flip is not influenced by the first. What is this an example of?
(Multiple Choice)
4.7/5 (40)
To determine the probability of pulling one of ten names out of a hat, we must divide the number of attempts by -----------.
(Multiple Choice)
4.9/5 (38)
A z-score of -1.5 is associated with a higher probability of an event occurring than a z-score of 1.2.
(True/False)
4.9/5 (29)
Suppose a statistics class has a distribution of grades with a mean of 70 and standard deviation of 15. Use this information to answer the following questions.
a. What score is at the 75th percentile?
b. What is the z-score associated with a raw score of 60?
c.What is the z-score associated with a raw score of 70?
d.What is the probability of scoring a 90 or higher in this class?
e.What is the probability of achieving agrade between 60 and 80 in this class?
f.What is the probability of scoring a 50 or higher?
g.What score is at the 40th percentile?
(Short Answer)
4.9/5 (37)
Suppose we have data on employees who earn an average wage of $22.00 per hour. If the standard deviation of wages is $4.00 per hour, what percentage of workers earn between $19.00 and $25.00?
(Multiple Choice)
4.8/5 (33)
On a standard, six-sided die, what is the probability of rolling a "2" or "5" on the first roll and a "6" on the second?
(Multiple Choice)
4.9/5 (42)
If a statistics class has a distribution of grades with a mean of 70 and standard deviation of 15, what is the probability of a student scoring between a 70 and 90?
(Multiple Choice)
4.7/5 (30)
On a standard, six-sided die, what is the probability of rolling a "2," "5," or "6"?
(Multiple Choice)
4.8/5 (34)
Filters
- Essay(0)
- Multiple Choice(0)
- Short Answer(0)
- True False(0)
- Matching(0)