Exam 15: Wage Rates in Competitive Labor Markets
Exam 1: Introduction150 Questions
Exam 2: Production Possibilities and Opportunity Costs166 Questions
Exam 3: Demand and Supply144 Questions
Exam 4: Elasticity160 Questions
Exam 5: Happiness, Utility, and Consumer Choice152 Questions
Exam 6: Price Ceilings and Price Floors159 Questions
Exam 7: Entrepreneurship and Business Ownership152 Questions
Exam 8: Costs of Production142 Questions
Exam 9: Maximizing Profit156 Questions
Exam 10: Identifying Markets and Market Structures181 Questions
Exam 11: Price and Output in Monopoly, Monopolistic Competition, and Perfect Competition185 Questions
Exam 12: Price and Output Determination Under Oligopoly193 Questions
Exam 13: Antitrust and Regulation157 Questions
Exam 14: Externalities, Market Failure, and Public Choice183 Questions
Exam 15: Wage Rates in Competitive Labor Markets164 Questions
Exam 16: Wages and Employment: Monopsony and Labor Unions164 Questions
Exam 17: Interest, Rent, and Profit184 Questions
Exam 18: Income Distribution and Poverty161 Questions
Exam 19: International Trade167 Questions
Exam 20: Exchange Rates, Balance of Payments, and International Debt174 Questions
Exam 21: The Economic Problems of Less-Developed Economies115 Questions
Select questions type
If working people in the economy become wealthier,
Free
(Multiple Choice)
4.9/5  (32)
(32)
Correct Answer: Verified
E
Which of the following is an illustration of the backward-bending supply curve?
Free
(Multiple Choice)
4.9/5 (44)
Correct Answer:Verified
A
The law of diminishing returns states that as more workers are hired, beyond some point,
Free
(Multiple Choice)
4.8/5 (32)
Correct Answer:Verified
C
A profit-maximizing firm will employ labor up to the point where MRP = wage.
(True/False)
4.7/5 (26)
When more workers are hired, the firm's output expands at an increasing rate only
(Multiple Choice)
4.8/5 (39)
Think totals: In a perfectly competitive labor market, the total labor cost curve, TLC
(Multiple Choice)
4.7/5 (34)
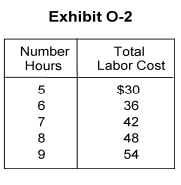 -In Exhibit O-2, the marginal labor cost of hiring a worker is
(Multiple Choice)
4.7/5 (28)
Technological improvement (e.g., better capital equipment) will result in a leftward shift of the marginal revenue product of labor.
(True/False)
4.9/5 (37)
The ethics justifying wage rate determination in a perfectly competitive labor market is
(Multiple Choice)
4.8/5 (33)
Specialization of labor can result in output increasing at an increasing rate.
(True/False)
4.9/5 (41)
Some careers, such as flight attendants, nurses, and primary school teachers, used to be considered "women's jobs." Other jobs, such as airline pilots, physicians, and school principals, were traditionally considered to be "men's jobs" and were not generally open to women. If women are allowed increased access to the jobs that had traditionally been considered to be "men's," explain the effects on wage rates.
(Short Answer)
4.7/5 (30)
The supply curve of labor is typically upward sloping because
(Multiple Choice)
4.9/5 (31)
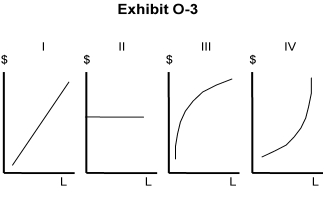 -In Exhibit O-2 and Exhibit O-3, using the data in Exhibit O-2, the labor supply curvefacing the firm in Exhibit O-3 would be shown in the graph labeled
(Multiple Choice)
4.9/5 (38)
When Lionel, an orange grower, hires Terry, Terry's marginal physical product per hour is 9 bushels of oranges. The price is $5 per bushel and the hourly wage rate is $55. Weknow then that
(Multiple Choice)
4.8/5 (38)
Persistent wage differentials in the U.S. can best be explained by
(Multiple Choice)
4.9/5 (34)
Prolonged war on a country's home soil is likely to expand a country's labor supply.
(True/False)
5.0/5 (36)
If demand for the finished good increases, the demand for the type of labor producing this good will also increase.
(True/False)
4.7/5 (24)
The optimal hiring rule is to keep hiring laborers until the ________ of the last laborerhired.
(Multiple Choice)
4.9/5 (26)
How do you explain why income inequality in the United States has been increasing?
(Multiple Choice)
4.8/5 (35)
Filters
- Essay(0)
- Multiple Choice(0)
- Short Answer(0)
- True False(0)
- Matching(0)