Exam 17: Global Change
Exam 1: Introduction to Earth Science35 Questions
Exam 2: Earth in Science34 Questions
Exam 3: Near-Earth Objects29 Questions
Exam 4: Plate Tectonics64 Questions
Exam 5: Earthquakes47 Questions
Exam 6: Volcanoes and Mountains36 Questions
Exam 7: Rocks and Minerals47 Questions
Exam 8: Geologic Time58 Questions
Exam 9: Weathering and Soils36 Questions
Exam 10: Landslides and Slope Failure30 Questions
Exam 11: Streams and Floods48 Questions
Exam 12: Groundwater and Wetlands36 Questions
Exam 13: Oceans and Coastlines51 Questions
Exam 14: The Atomosphere46 Questions
Exam 15: Weather Systems40 Questions
Exam 16: Earths Climate System50 Questions
Exam 17: Global Change39 Questions
Select questions type
Suppose the global community came to an agreement to reduce CO2 emissions that had the same impact as the Montreal Protocol had for CFCs. Predict how CO2 levels would change over the next several decades.
Free
(Multiple Choice)
4.9/5  (44)
(44)
Correct Answer: Verified
C
Carbon dioxide levels in the atmosphere first began to rapidly increase above natural levels around 1950.
Free
(True/False)
4.9/5 (45)
Correct Answer:Verified
False
Suppose each of the following compounds were released into the atmosphere in equal amounts. Which greenhouse gas would cause the most warming?
Free
(Multiple Choice)
4.7/5 (23)
Correct Answer:Verified
A
Global sea levels have increased 1-2 meters over the last century.
(True/False)
4.8/5 (31)
Which one of the following characteristics does not contribute to ozone depletion over Antarctica?
(Multiple Choice)
4.8/5 (37)
The following diagram illustrates the Carbon Cycle. Each arrow represents the transfer of carbon from one component of the Earth system to another. For example, arrow 1 represents the transfer of carbon from the biosphere to the atmosphere. Match the lettered answers below to the number on the diagram.
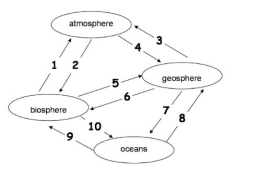 -Match the lettered answers to number 8 on the diagram.
(Multiple Choice)
4.7/5 (42)
Global precipitation has increased as temperatures increased over the last century.
(True/False)
4.8/5 (31)
The following diagram illustrates the Carbon Cycle. Each arrow represents the transfer of carbon from one component of the Earth system to another. For example, arrow 1 represents the transfer of carbon from the biosphere to the atmosphere. Match the lettered answers below to the number on the diagram.
-Match the lettered answers to number 9 on the diagram.
(Multiple Choice)
4.8/5 (36)
The following diagram illustrates the Carbon Cycle. Each arrow represents the transfer of carbon from one component of the Earth system to another. For example, arrow 1 represents the transfer of carbon from the biosphere to the atmosphere. Match the lettered answers below to the number on the diagram.
-Match the lettered answers to number 5 on the diagram.
(Multiple Choice)
4.7/5 (29)
Global concentrations of carbon dioxide have increased by ~30% over the last 150 years.
(True/False)
5.0/5 (38)
Suppose you have a choice of fuels to use to heat your home. Which CO2 source produces the least carbon per unit of energy?
(Multiple Choice)
4.8/5 (30)
Atmospheric levels of CO2 are higher than have been documented in the past 500,000 years.
(True/False)
4.8/5 (33)
What would happen to ozone levels if global volcanic activity increased?
(Multiple Choice)
4.8/5 (37)
Why has the rate of global warming been slower than expected over parts of the Northern hemisphere?
(Multiple Choice)
4.8/5 (41)
The Earth can take care of the CO2 problem by itself on human timescales.
(True/False)
4.8/5 (40)
What has happened to average global temperatures over the last 100 years?
(Multiple Choice)
4.9/5 (33)
Filters
- Essay(0)
- Multiple Choice(0)
- Short Answer(0)
- True False(0)
- Matching(0)