Exam 19: Factorial Analysis of Variance
Exam 1: Introduction25 Questions
Exam 2: Frequency Distributions, Percentiles,34 Questions
Exam 3: Graphic Representation of Frequency Distributions25 Questions
Exam 4: Central Tendency25 Questions
Exam 5: Variability and Standard Z Scores37 Questions
Exam 6: Standard Scores and the Normal Curve27 Questions
Exam 7: Correlation38 Questions
Exam 8: Prediction40 Questions
Exam 9: Interpretive Aspects of Correlation and Regression23 Questions
Exam 10: Probability29 Questions
Exam 11: Random Sampling and Sampling Distributions24 Questions
Exam 12: Introduction to Statistical Inference: Testing Hypotheses About Single Means Z and T74 Questions
Exam 13: Interpreting the Results of Hypothesis Testing: Effect Size, Type I and Type II Errors, and Power42 Questions
Exam 14: Testing Hypotheses About the Difference Between Two Independent Groups33 Questions
Exam 15: Testing for a Difference18 Questions
Exam 16: Inference About Correlation Coefficients24 Questions
Exam 17: An Alternative to Hypothesis Testing: Confidence Intervals28 Questions
Exam 18: Testing for Differences Among Three or More Groups: One-Way Analysis of Variance and Some Alternatives49 Questions
Exam 19: Factorial Analysis of Variance30 Questions
Exam 20: Chi-Square and Inference About Frequencies27 Questions
Exam 21: Some Almost Assumption-Free Tests19 Questions
Select questions type
In two-factor analysis of variance, the denominator of the F-test is
(Multiple Choice)
4.8/5  (31)
(31)
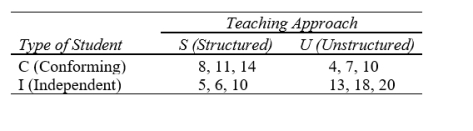
Two approaches, S (structured) and U (unstructured), to teaching a required undergraduate course in social research methods are to be compared with regard to their effects on student interest in social research. Students signing up for the course are classified as Type C (conforming) or Type I (independent) individuals according to personality test results. On a random basis, half of each type of student are assigned to section S of the course and half to section U. At the end of the course, scores are obtained on a scale of interest in social research and are analyzed using a two-factor analysis of variance.
The interest (in social research) scores are given below (normally far more cases would be used).
(a)Compute the variance estimates; complete the F tests at  and
and  ; and draw statistical conclusions. Show your results in a summary analysis of variance table
(b)Construct a table showing cell and marginal means. Considering the F-test results, which means would be of interest? Why?
(c)Construct a graph of the cell means. Draw final conclusions concerning the two treatment variables.
; and draw statistical conclusions. Show your results in a summary analysis of variance table
(b)Construct a table showing cell and marginal means. Considering the F-test results, which means would be of interest? Why?
(c)Construct a graph of the cell means. Draw final conclusions concerning the two treatment variables.
(Short Answer)
4.8/5 (41)
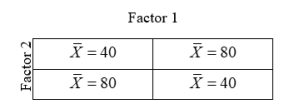
Suppose, in a two-way analysis of variance, based on 15 cases per cell, the indicated cell means were observed. We might expect to find that there will be a significant
(Multiple Choice)
4.9/5 (39)
We are studying the effect of two methods of learning, using bright students and dull students, in a two-way analysis of variance. Interaction between method and level of intelligence would be suggested if we found that
(Multiple Choice)
4.9/5 (33)
In general, the number of degrees of freedom for the within-cells variance estimate is
(Multiple Choice)
4.7/5 (38)
A graph is made of the cell means for a two-factor ANOVA. The lines connecting the means for each row are reasonably parallel. This suggests
(Multiple Choice)
4.9/5 (37)
Using an equal number of cases per group is recommended practice
(Multiple Choice)
4.9/5 (44)
(a) -(e)Draw a graph of the cell means for each of the tables above. Let the horizontal axis represent the column variable. In each case, see if you can arrive at correct conclusions concerning the presence (or absence) of row, column, and interaction effects from the graph alone. Bear in mind that the tables of Problem 1 are highly artificial; they are population values and do not reflect the effects of the sampling variation that would be encountered in practice.
(Short Answer)
4.7/5 (43)
In the tables below, population (not sample) means are given for the cells. In each case, compute the marginal means and indicate whether the table shows (1) a main row effect, (2) a main column effect, (3) an interaction effect. Remember: population values do not show the effects of sampling variation. 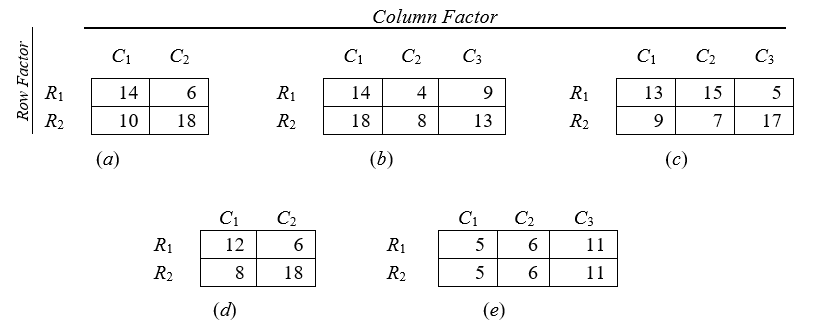
(Short Answer)
4.9/5 (32)
In general, the number of degrees of freedom for row by column interaction is given by
(Multiple Choice)
4.9/5 (39)
Filters
- Essay(0)
- Multiple Choice(0)
- Short Answer(0)
- True False(0)
- Matching(0)