Exam 3: Where Prices Come From: the Interaction of Demand and Supply
Exam 1: Economics: Foundations and Models444 Questions
Exam 2: Trade-Offs, comparative Advantage, and the Market System498 Questions
Exam 3: Where Prices Come From: the Interaction of Demand and Supply475 Questions
Exam 4: Market Efficiency and Market Failure465 Questions
Exam 5: The Economics of Health Care334 Questions
Exam 6: Firms, the Stock Market, and Corporate Governance250 Questions
Exam 7: Consumer Choice and Elasticity380 Questions
Exam 8: Technology, production, and Costs276 Questions
Exam 9: Firms in Perfectly Competitive Markets297 Questions
Exam 10: Monopoly and Antitrust Policy271 Questions
Exam 11: Monopolistic Competition and Oligopoly414 Questions
Exam 12: Gdp: Measuring Total Production and Income266 Questions
Exam 13: Unemployment and Inflation292 Questions
Exam 14: Economic Growth, the Financial System, and Business Cycles257 Questions
Exam 15: Aggregate Demand and Aggregate Supply Analysis284 Questions
Exam 16: Money, banks, and the Federal Reserve System279 Questions
Exam 17: Monetary Policy277 Questions
Exam 18: Fiscal Policy282 Questions
Exam 19: Comparative Advantage, international Trade, and Exchange Rates446 Questions
Select questions type
Figure 3-7
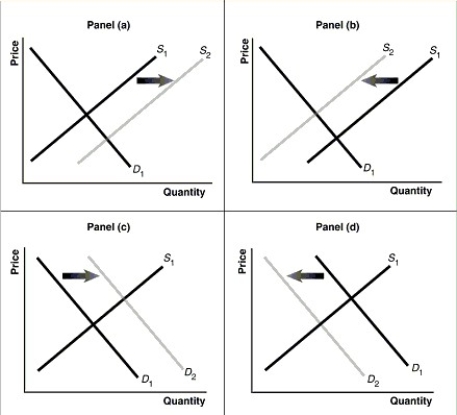 -Refer to Figure 3-7.Assume that the graphs in this figure represent the demand and supply curves for ramen noodles,an inferior good.Which panel describes what happens in this market as a result of an increase in income?
(Multiple Choice)
4.8/5  (41)
(41)
Select the phrase that correctly completes the following statement."A positive change in technology caused an increase in the supply of flat-screen televisions.As a result
(Multiple Choice)
4.8/5 (42)
When the price of a good rises,consumers buy a smaller quantity because of the ________ effect and the ________ effect.
(Multiple Choice)
4.7/5 (31)
The substitution effect explains why there is an inverse relationship between the price of a product and the quantity of the product demanded.
(True/False)
4.8/5 (34)
Suppose a negative technological change in the production of disease-resistant wheat caused the price of wheat to rise.Holding everything else constant,how would this affect the market for corn (a substitute for wheat)?
(Multiple Choice)
4.8/5 (43)
Suppose that when the price of hamburgers decreases,the Landry family decreases their purchases of chicken nuggets.To the Landry family
(Multiple Choice)
4.9/5 (33)
Cole was discussing the market for cocoa beans with his friend John Schmidt.Cole said,"Ever since Venezuela announced that its cocoa harvest was its lowest ever in fifteen years,the price of cocoa beans has been rising and rising and people are buying more and more.I think the demand for cocoa beans must be upward sloping." Is Cole right? Briefly explain why or why not.
(Essay)
4.9/5 (30)
Figure 3-1
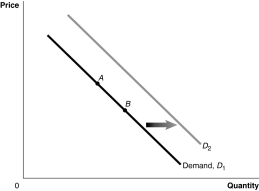 -Refer to Figure 3-1.If the product represented is a normal good,an increase in income would be represented by a movement from
(Multiple Choice)
4.9/5 (36)
Which of the following would cause the equilibrium price of ketchup to increase and the equilibrium quantity of ketchup to decrease?
(Multiple Choice)
4.8/5 (35)
Studies have shown that drinking one glass of red wine per day may help prevent heart disease.Assume this is true,and favorable weather has increased the grape harvest of California vineyards.In the market for red wine,these two developments would
(Multiple Choice)
4.7/5 (26)
Table 3-2
Caviar Price per oz. (dollars) Ari's Quantity Demanded (oz.) Sonia's Quantity Demanded (oz.) Rest of Market Quantity Demanded (oz.) Market Quantity Demanded (oz.) \ 75 6 0 46 65 18 6 64 55 28 14 136 45 36 24 170 35 44 36 220
-Refer to Table 3-2.The table above shows the demand schedules for caviar of two individuals (Ari and Sonia)and the rest of the market.At a price of $55,the quantity demanded in the market would be
(Multiple Choice)
5.0/5 (37)
If the price of peaches,a substitute for plums,increases the demand for plums will decrease.
(True/False)
4.9/5 (33)
Digital video recorders (DVRs)were introduced to the market in 1999,and new technology has allowed for the cost of manufacturing the recorders to decline significantly since the initial introduction.How did this change in technology affect the market for DVRs?
(Multiple Choice)
4.8/5 (43)
Scarcity is defined as the situation that exists when the quantity demanded for a good is greater than the quantity supplied.
(True/False)
4.8/5 (42)
In each of the following situations,list what will happen to the equilibrium price and the equilibrium quantity for a particular product,which is a normal good.
a.The population increases and the price of inputs increase
b.The price of a complement increases and technology advances
c.The number of firms in the market increases and income increases
d.Price is expected to increase in the future
e.Consumer preference increases and the price of a substitute in production decreases
(Essay)
4.8/5 (35)
Draw a supply and demand graph showing an equilibrium price of $50 and an equilibrium quantity of 200 units.Explain what would happen if the selling price was $75,and illustrate this on the graph.Explain what would happen if the selling price was $25,and illustrate this on the graph.Be sure to label each axis and curve on the graph.
(Essay)
4.9/5 (35)
All else equal,as the price of a product falls,the quantity supplied decreases.
(True/False)
4.9/5 (43)
An increase in the demand for LED light bulbs due to changes in consumer tastes,accompanied by an increase in the supply of LED light bulbs as a result of government subsidies,will result in
(Multiple Choice)
4.7/5 (38)
The law of demand implies,holding everything else constant,that as the price of gelato
(Multiple Choice)
4.9/5 (36)
Filters
- Essay(0)
- Multiple Choice(0)
- Short Answer(0)
- True False(0)
- Matching(0)