Exam 3: Where Prices Come From: the Interaction of Demand and Supply
Exam 1: Economics: Foundations and Models444 Questions
Exam 2: Trade-Offs, comparative Advantage, and the Market System498 Questions
Exam 3: Where Prices Come From: the Interaction of Demand and Supply475 Questions
Exam 4: Market Efficiency and Market Failure465 Questions
Exam 5: The Economics of Health Care334 Questions
Exam 6: Firms, the Stock Market, and Corporate Governance250 Questions
Exam 7: Consumer Choice and Elasticity380 Questions
Exam 8: Technology, production, and Costs276 Questions
Exam 9: Firms in Perfectly Competitive Markets297 Questions
Exam 10: Monopoly and Antitrust Policy271 Questions
Exam 11: Monopolistic Competition and Oligopoly414 Questions
Exam 12: Gdp: Measuring Total Production and Income266 Questions
Exam 13: Unemployment and Inflation292 Questions
Exam 14: Economic Growth, the Financial System, and Business Cycles257 Questions
Exam 15: Aggregate Demand and Aggregate Supply Analysis284 Questions
Exam 16: Money, banks, and the Federal Reserve System279 Questions
Exam 17: Monetary Policy277 Questions
Exam 18: Fiscal Policy282 Questions
Exam 19: Comparative Advantage, international Trade, and Exchange Rates446 Questions
Select questions type
If the price of pork rinds falls,the substitution effect due to the price change will cause
(Multiple Choice)
4.8/5  (39)
(39)
A decrease in the demand for eggs due to changes in consumer tastes,accompanied by a decrease in the supply of eggs as a result of an outbreak of Avian flu,will result in
(Multiple Choice)
4.8/5 (41)
By drawing a demand curve with price on the vertical axis and quantity on the horizontal axis,economists assume that the most important determinant of the demand for a good is
(Multiple Choice)
4.8/5 (41)
What is the difference between an "increase in supply" and an "increase in quantity supplied"?
(Multiple Choice)
4.9/5 (37)
Which of the following would shift the supply curve for smartphones to the right?
(Multiple Choice)
4.8/5 (33)
A surplus occurs when the actual selling price is above the market equilibrium price.
(True/False)
4.9/5 (42)
Assume there is a shortage in the market for digital music players.Which of the following statements correctly describes this situation?
(Multiple Choice)
5.0/5 (48)
Figure 3-2
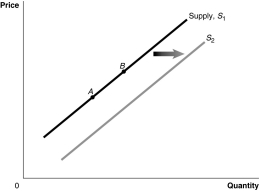 -Refer to Figure 3-2.An increase in price of inputs would be represented by a movement from
(Multiple Choice)
4.8/5 (37)
Studies have shown that smoking cigarettes can cause heart disease.Assume this is true,and favorable weather has increased the tobacco harvest in North Carolina.In the market for cigarettes,these two developments would
(Multiple Choice)
4.8/5 (31)
If the demand curve for a product shifts to the right and the supply curve for the product shifts to the left,equilibrium price and equilibrium quantity will both increase.
(True/False)
4.9/5 (41)
In response to a surplus the market price of a good will fall; as the price falls,the quantity demanded will increase and quantity supplies will decrease until equilibrium is reached.
(True/False)
4.8/5 (42)
Table 3-2
Caviar Price per oz. (dollars) Ari's Quantity Demanded (oz.) Sonia's Quantity Demanded (oz.) Rest of Market Quantity Demanded (oz.) Market Quantity Demanded (oz.) \ 75 6 0 46 65 18 6 64 55 28 14 136 45 36 24 170 35 44 36 220
-Refer to Table 3-2.The table above shows the demand schedules for caviar of two individuals (Ari and Sonia)and the rest of the market.At a price of $75,the quantity demanded in the market would be
(Multiple Choice)
5.0/5 (38)
Figure 3-3
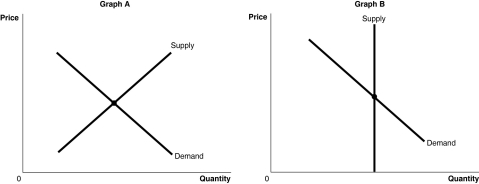 -Refer to Figure 3-3.The figure above shows the supply and demand curves for two markets: the market for original Picasso paintings and the market for designer jeans.Which graph most likely represents which market?
(Multiple Choice)
5.0/5 (30)
Figure 3-1
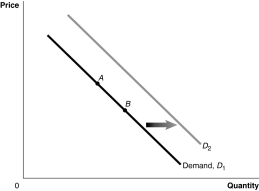 -Refer to Figure 3-1.If the product represented is an inferior good,a decrease in income would be represented by a movement from
(Multiple Choice)
4.8/5 (42)
If the demand for a product decreases and the supply of the same product decreases,the equilibrium price will decrease.
(True/False)
4.7/5 (40)
Figure 3-7
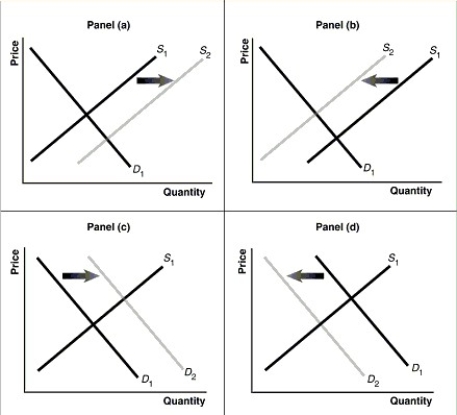 -Refer to Figure 3-7.Assume that the graphs in this figure represent the demand and supply curves for rice.What happens in this market if buyers expect the price of rice to fall?
(Multiple Choice)
4.9/5 (33)
Figure 3-8
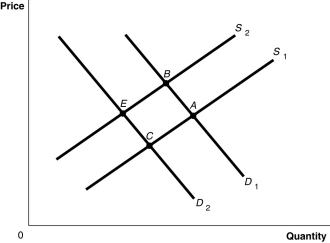 -Refer to Figure 3-8.The graph in this figure illustrates an initial competitive equilibrium in the market for motorcycles at the intersection of D₁ and S₁ (point A) If there is a surplus of motorcycles how will the equilibrium point change?
(Multiple Choice)
4.8/5 (29)
From a supply perspective,what impact would an increase in the price of motorcycles have on the market for motorcycles?
(Essay)
4.8/5 (39)
A change in which variable will change the market demand for a product?
(Multiple Choice)
4.8/5 (41)
Filters
- Essay(0)
- Multiple Choice(0)
- Short Answer(0)
- True False(0)
- Matching(0)