Exam 3: Where Prices Come From: the Interaction of Demand and Supply
Exam 1: Economics: Foundations and Models444 Questions
Exam 2: Trade-Offs, comparative Advantage, and the Market System498 Questions
Exam 3: Where Prices Come From: the Interaction of Demand and Supply475 Questions
Exam 4: Market Efficiency and Market Failure465 Questions
Exam 5: The Economics of Health Care334 Questions
Exam 6: Firms, the Stock Market, and Corporate Governance250 Questions
Exam 7: Consumer Choice and Elasticity380 Questions
Exam 8: Technology, production, and Costs276 Questions
Exam 9: Firms in Perfectly Competitive Markets297 Questions
Exam 10: Monopoly and Antitrust Policy271 Questions
Exam 11: Monopolistic Competition and Oligopoly414 Questions
Exam 12: Gdp: Measuring Total Production and Income266 Questions
Exam 13: Unemployment and Inflation292 Questions
Exam 14: Economic Growth, the Financial System, and Business Cycles257 Questions
Exam 15: Aggregate Demand and Aggregate Supply Analysis284 Questions
Exam 16: Money, banks, and the Federal Reserve System279 Questions
Exam 17: Monetary Policy277 Questions
Exam 18: Fiscal Policy282 Questions
Exam 19: Comparative Advantage, international Trade, and Exchange Rates446 Questions
Select questions type
Which of the following is evidence of a shortage of chocolate?
(Multiple Choice)
4.7/5  (32)
(32)
Assume that both the demand curve and the supply curve for DVD players shift to the left but the supply curve shifts more than the demand curve.As a result
(Multiple Choice)
4.8/5 (38)
As the number of firms in a market decreases,the supply curve will shift to the left and the equilibrium price will rise.
(True/False)
4.8/5 (39)
The income effect explains why there is an inverse relationship between the price of a product and the quantity of the product demanded.
(True/False)
4.8/5 (38)
Figure 3-1
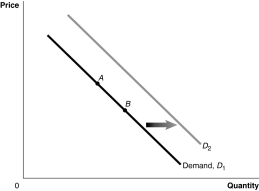 -Refer to Figure 3-1.A decrease in the price of a complementary good would be represented by a movement from
(Multiple Choice)
4.8/5 (34)
Figure 3-8
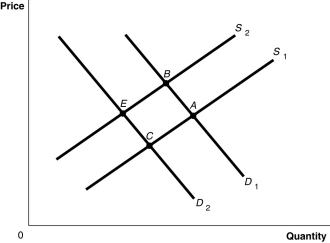 -Refer to Figure 3-8.The graph in this figure illustrates an initial competitive equilibrium in the market for apples at the intersection of D₁ and S₂ (point B) Which of the following changes would cause the equilibrium to change to point C?
(Multiple Choice)
4.9/5 (45)
Figure 3-8
-Refer to Figure 3-8.The graph in this figure illustrates an initial competitive equilibrium in the market for apples at the intersection of D₁ and S₁ (point A)If the price of oranges, a substitute for apples, decreases and the wages of apple workers increase, how will the equilibrium point change?
(Multiple Choice)
4.9/5 (40)
If the number of firms producing electric cars increases and consumer preference for electric cars increases,the equilibrium quantity of electric cars will definitely increase.
(True/False)
4.9/5 (46)
For each of the following pairs of products state which are complements,which are substitutes,and which are unrelated.
a.House plants and potato chips
b.Eyeglasses and contact lenses
c.Motorcycles and gasoline
d.Smartphone and smartphone apps
e.Red wine and white wine
(Essay)
4.9/5 (41)
Use the following supply schedule for cherries to draw a graph of the supply curve.Be sure to label the supply curve and each axis,and show each point on the supply curve.
Price (dollars per bushel) Quantity (thausands af bushels) 4 25 8 50 12 75 16 100 20 125
(Essay)
4.9/5 (36)
Figure 3-6
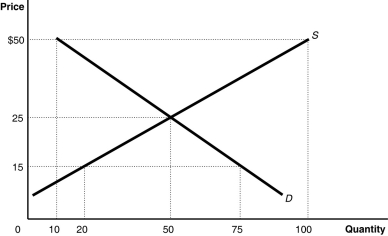 -Refer to Figure 3-6.The figure above represents the market for canvas tote bags.Assume that the market price is $35.Which of the following statement is true?
(Multiple Choice)
4.7/5 (32)
Suppose that when the price of oranges decreases,the Sarita decreases her purchases of peaches.To Sarita
(Multiple Choice)
4.9/5 (39)
For each of the following pairs of products state which are complements,which are substitutes,and which are unrelated.
a.Blu-ray discs and video-on-demand
b.Fiat 500 and Mini Cooper S
c.Toothpaste and toothbrush
d.Popcorn and snowboards
e.Razors and razor blades
(Essay)
4.8/5 (28)
"Because chips and salsa are complements,an increase in the price of chips will cause the demand for salsa to decrease.This initial shift in demand for chips results in a higher price for chips; this higher price will cause the demand curve for chips to shift to the right." Which of the following correctly comments on this statement?
(Multiple Choice)
5.0/5 (37)
Figure 3-7
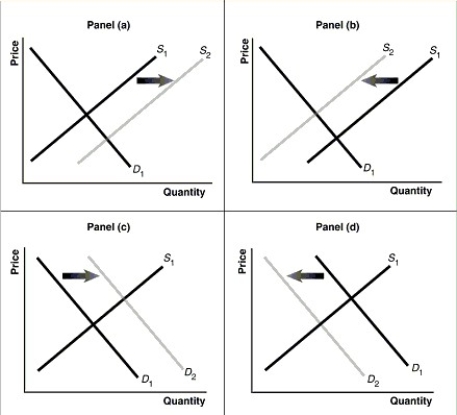 -Refer to Figure 3-7.Assume that the graphs in this figure represent the demand and supply curves for coffee.What happens in this market if buyers expect the price of coffee to rise?
(Multiple Choice)
4.9/5 (33)
If the population increases and input prices decrease,the equilibrium quantity of a product will definitely increase.
(True/False)
5.0/5 (34)
Prices of microbrewery beer (assume that this is a normal good)have risen steadily in recent years.Over this same period,prices for fermenting vats used in beer making have also risen and consumer incomes have fallen.Which of the following best explains the rising prices of microbrewery beer?
(Multiple Choice)
4.9/5 (30)
The cost of producing cigarettes in the U.S.has increased and at the same time,more and more Americans are choosing to not smoke cigarettes.Which of the following best explains the effect of these events in the cigarette market?
(Multiple Choice)
4.8/5 (41)
Peanut butter and jelly are complements.If the price of peanut butter increases,the demand for jelly will increase.
(True/False)
4.8/5 (43)
Filters
- Essay(0)
- Multiple Choice(0)
- Short Answer(0)
- True False(0)
- Matching(0)