Exam 3: Where Prices Come From: the Interaction of Demand and Supply
Exam 1: Economics: Foundations and Models240 Questions
Exam 2: Trade-Offs, Comparative Advantage, and the Market System258 Questions
Exam 3: Where Prices Come From: the Interaction of Demand and Supply242 Questions
Exam 4: Economic Efficiency, Government Price Setting, and Taxes208 Questions
Exam 5: Externalities, Environmental Policy, and Public Goods262 Questions
Exam 6: Elasticity: the Responsiveness of Demand and Supply293 Questions
Exam 7: The Economics of Health Care171 Questions
Exam 8: Firms, the Stock Market, and Corporate Governance261 Questions
Exam 9: Comparative Advantage and the Gains From International Trade188 Questions
Exam 10: Consumer Choice and Behavioral Economics304 Questions
Exam 11: Technology, Production, and Costs327 Questions
Exam 12: Firms in Perfectly Competitive Markets297 Questions
Exam 13: Monopolistic Competition: the Competitive Model in a272 Questions
Exam 14: Oligopoly: Firms in Less Competitive Markets257 Questions
Exam 15: Monopoly and Antitrust Policy279 Questions
Exam 16: Pricing Strategy258 Questions
Exam 17: The Markets for Labor and Other Factors of Production279 Questions
Exam 18: Public Choice, Taxes, and the Distribution of Income258 Questions
Select questions type
Figure 3-6
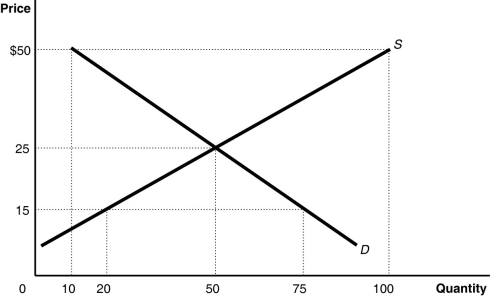 -Refer to Figure 3-6.The figure above represents the market for canvas tote bags.Compare the conditions in the market when the price is $50 and when the price is $35.Which of the following describes how the market differs at these prices?
(Multiple Choice)
5.0/5  (42)
(42)
In 1984, the National Minimum Drinking Age Act was passed, raising the legal age to consume alcoholic beverages in the United States to 21.In much of Europe, the legal age to consume alcohol is 18.If the legal drinking age in the United States was changed back to 18, how would this affect the market for alcoholic beverages? What would happen to the equilibrium price and quantity of alcoholic beverages?
(Essay)
4.9/5 (36)
If the demand curve for a product shifts to the left and the supply curve for the product shifts to the left, the equilibrium quantity will decrease.
(True/False)
4.8/5 (33)
How does the decreasing use of traditional cameras affect the market for traditional camera film?
(Multiple Choice)
4.9/5 (40)
A change in supply is represented by a shift of the supply curve.
(True/False)
4.8/5 (30)
Scarcity is defined as the situation that exists when the quantity demanded for a good is greater than the quantity supplied.
(True/False)
4.9/5 (39)
Assume that potatoes are an inferior good.Which of the following would cause both the equilibrium price and equilibrium quantity of potatoes to decrease?
(Multiple Choice)
4.9/5 (29)
What are the two effects that explain the law of demand? Briefly explain each effect.
(Essay)
4.8/5 (37)
An increase in the demand for lobster due to changes in consumer tastes, accompanied by a decrease in the supply of lobster as a result bad weather reducing the number of fishermen trapping lobster, will result in
(Multiple Choice)
4.8/5 (39)
Which of the following would cause a decrease in the supply of milk?
(Multiple Choice)
4.7/5 (33)
The income effect of a price change refers to the impact of a change in
(Multiple Choice)
4.7/5 (35)
Which of the following will shift the demand curve for a good?
(Multiple Choice)
4.8/5 (33)
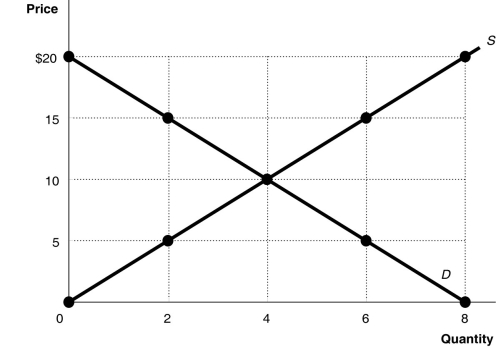
Figure 3-4
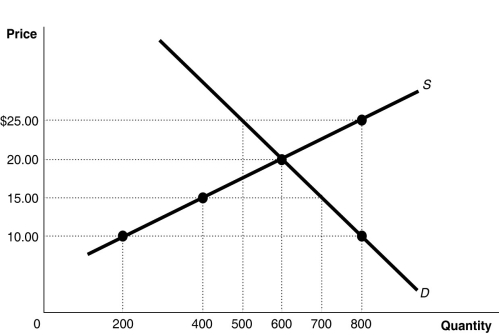 -Refer to Figure 3-4.At a price of $15, how many units will be sold?
(Multiple Choice)
4.8/5 (34)
Figure 3-8
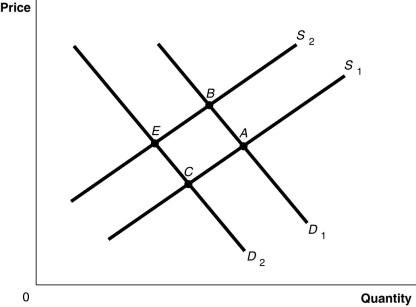 -Refer to Figure 3-8.The graph in this figure illustrates an initial competitive equilibrium in the market for apples at the intersection of D₁ and S₂ (point B). Which of the following changes would cause the equilibrium to change to point C?
(Multiple Choice)
4.9/5 (34)
Use the following supply schedule for cherries to draw a graph of the supply curve.Be sure to label the supply curve and each axis, and show each point on the supply curve.

(Essay)
4.8/5 (31)
Figure 3-7
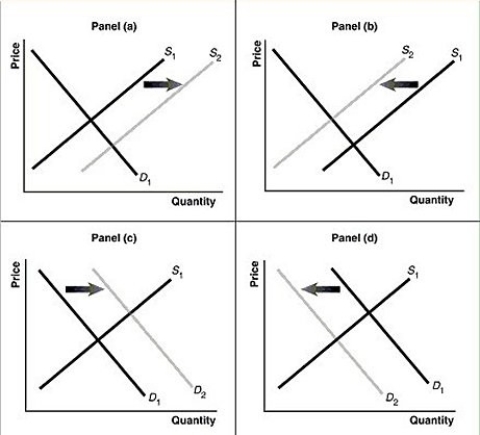 -Refer to Figure 3-7.Assume that the graphs in this figure represent the demand and supply curves for Fruitopia, a soft drink.Which panel describes what happens in the market for Fruitopia when the price of Snapple, a substitute product, decreases?
(Multiple Choice)
4.9/5 (37)
Figure 3-5
 -Refer to Figure 3-5.In a free market such as that depicted above, a surplus is eliminated by
(Multiple Choice)
4.9/5 (32)
The law of demand implies, holding everything else constant, that as the price of bagels increases.
(Multiple Choice)
4.8/5 (36)
Filters
- Essay(0)
- Multiple Choice(0)
- Short Answer(0)
- True False(0)
- Matching(0)