Exam 3: Where Prices Come From: the Interaction of Demand and Supply
Exam 1: Economics: Foundations and Models240 Questions
Exam 2: Trade-Offs, Comparative Advantage, and the Market System258 Questions
Exam 3: Where Prices Come From: the Interaction of Demand and Supply242 Questions
Exam 4: Economic Efficiency, Government Price Setting, and Taxes208 Questions
Exam 5: Externalities, Environmental Policy, and Public Goods262 Questions
Exam 6: Elasticity: the Responsiveness of Demand and Supply293 Questions
Exam 7: The Economics of Health Care171 Questions
Exam 8: Firms, the Stock Market, and Corporate Governance261 Questions
Exam 9: Comparative Advantage and the Gains From International Trade188 Questions
Exam 10: Consumer Choice and Behavioral Economics304 Questions
Exam 11: Technology, Production, and Costs327 Questions
Exam 12: Firms in Perfectly Competitive Markets297 Questions
Exam 13: Monopolistic Competition: the Competitive Model in a272 Questions
Exam 14: Oligopoly: Firms in Less Competitive Markets257 Questions
Exam 15: Monopoly and Antitrust Policy279 Questions
Exam 16: Pricing Strategy258 Questions
Exam 17: The Markets for Labor and Other Factors of Production279 Questions
Exam 18: Public Choice, Taxes, and the Distribution of Income258 Questions
Select questions type
Assume that cotton is a normal good.Which of the following would cause both the equilibrium price and equilibrium quantity of cotton to increase?
(Multiple Choice)
4.9/5  (29)
(29)
What is the difference between an "increase in demand" and an "increase in quantity demanded"?
(Multiple Choice)
4.7/5 (30)
Figure 3-8
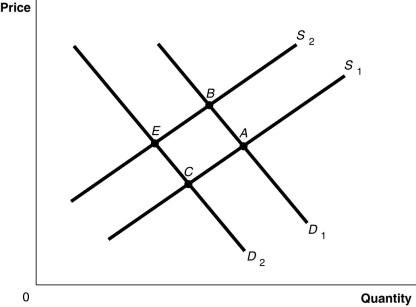 -Refer to Figure 3-8.The graph in this figure illustrates an initial competitive equilibrium in the market for apples at the intersection of D₁ and S₁ (point A). If there is an increase in the wages of apple workers and an increase in the price of oranges, a substitute for apples, the equilibrium could move to which point?
(Multiple Choice)
4.7/5 (34)
Nearly one-fifth of China's 1.38 billion people are under the age of 15.How will this affect high school enrollment over the next fifteen years? The labor market over the next fifteen years?
(Essay)
4.8/5 (38)
Let D = demand, S = supply, P = equilibrium price, and Q= equilibrium quantity.What happens in the market for tropical hardwood trees if the governments restrict the amount of forest lands that can be logged?
(Multiple Choice)
4.9/5 (33)
Table 3-2
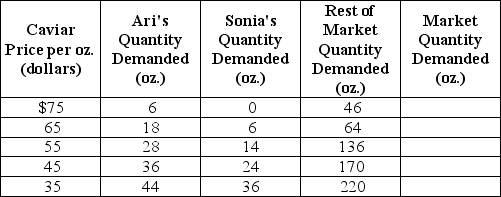 -Refer to Table 3-2.The table above shows the demand schedules for caviar of two individuals (Ari and Sonia)and the rest of the market.If the price of caviar rises from $65 to $75, the market quantity demanded would
(Multiple Choice)
4.8/5 (30)
A(n)________ is represented by a leftward shift of the demand curve while a(n)________ is represented by a movement along a given demand curve.
(Multiple Choice)
4.9/5 (28)
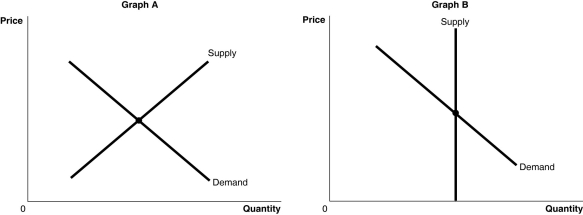
Figure 3-7
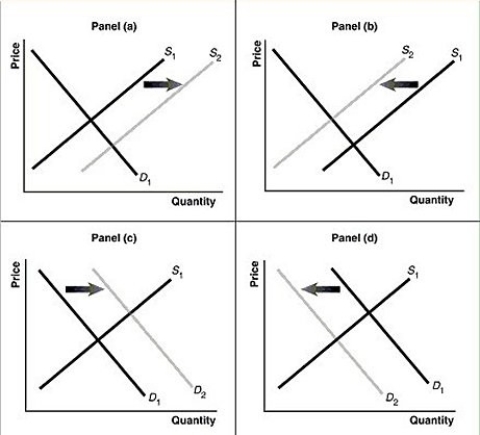 -Refer to Figure 3-7.Assume that the graphs in this figure represent the demand and supply curves for used clothing, an inferior good.Which panel describes what happens in this market as a result of a decrease in income?
(Multiple Choice)
4.9/5 (31)
If the price of refillable butane lighters was to decrease, then
(Multiple Choice)
4.9/5 (31)
Table 3-1
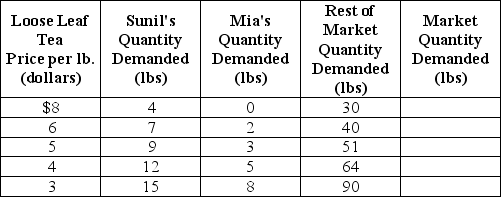 -Refer to Table 3-1.The table above shows the demand schedules for loose-leaf tea of two individuals (Sunil and Mia)and the rest of the market.At a price of $5, the quantity demanded in the market would be
(Multiple Choice)
4.8/5 (34)
A decrease in the demand for soft drinks due to changes in consumer tastes, accompanied by an increase in the supply of soft drinks as a result of reductions in input prices, will result in
(Multiple Choice)
4.9/5 (35)
Elvira decreased her consumption of bananas when the price of peanut butter increased.For Elvira, peanut butter and bananas are
(Multiple Choice)
4.8/5 (35)
Explain the differences between a change in supply and a change in quantity supplied.
(Essay)
4.8/5 (30)
Figure 3-2
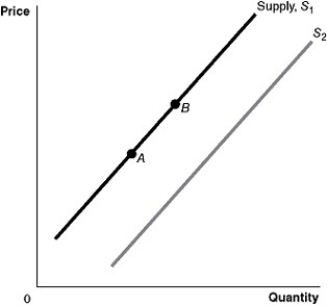 -Refer to Figure 3-2.An increase in price of inputs would be represented by a movement from
(Multiple Choice)
4.9/5 (32)
Assume that both the demand curve and the supply curve for MP3 players shift to the right but the supply curve shifts more than the demand curve.As a result
(Multiple Choice)
4.8/5 (31)
Figure 3-3
 -Refer to Figure 3-3.The figure above shows the supply and demand curves for two markets: the market for an original Picasso painting and the market for designer jeans.Which graph most likely represents which market?
(Multiple Choice)
4.8/5 (27)
Figure 3-1
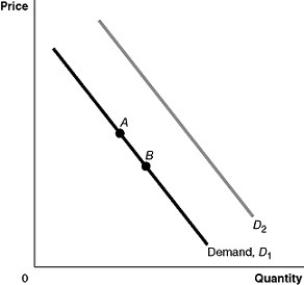 -Refer to Figure 3-1.A decrease in the price of a substitute good would be represented by a movement from
(Multiple Choice)
4.8/5 (36)
Technological advances have resulted in lower prices for digital cameras.What is the impact of this on the market for traditional (non-digital)cameras?
(Multiple Choice)
4.8/5 (35)
Filters
- Essay(0)
- Multiple Choice(0)
- Short Answer(0)
- True False(0)
- Matching(0)