Exam 18: Public Choice, Taxes, and the Distribution of Income
Exam 1: Economics: Foundations and Models240 Questions
Exam 2: Trade-Offs, Comparative Advantage, and the Market System258 Questions
Exam 3: Where Prices Come From: the Interaction of Demand and Supply242 Questions
Exam 4: Economic Efficiency, Government Price Setting, and Taxes208 Questions
Exam 5: Externalities, Environmental Policy, and Public Goods262 Questions
Exam 6: Elasticity: the Responsiveness of Demand and Supply293 Questions
Exam 7: The Economics of Health Care171 Questions
Exam 8: Firms, the Stock Market, and Corporate Governance261 Questions
Exam 9: Comparative Advantage and the Gains From International Trade188 Questions
Exam 10: Consumer Choice and Behavioral Economics304 Questions
Exam 11: Technology, Production, and Costs327 Questions
Exam 12: Firms in Perfectly Competitive Markets297 Questions
Exam 13: Monopolistic Competition: the Competitive Model in a272 Questions
Exam 14: Oligopoly: Firms in Less Competitive Markets257 Questions
Exam 15: Monopoly and Antitrust Policy279 Questions
Exam 16: Pricing Strategy258 Questions
Exam 17: The Markets for Labor and Other Factors of Production279 Questions
Exam 18: Public Choice, Taxes, and the Distribution of Income258 Questions
Select questions type
Figure 18-1
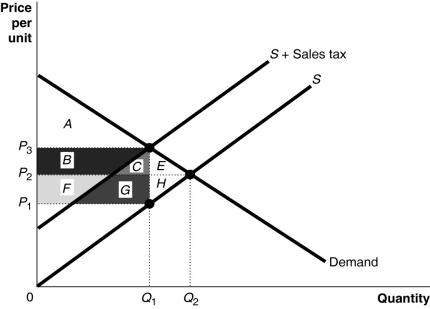 -Refer to Figure 18-1.The excess burden of the tax is represented by the area
Free
(Multiple Choice)
4.8/5  (34)
(34)
Correct Answer: Verified
C
Figure 18-6
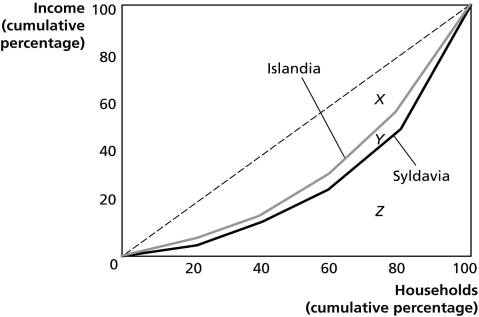 Figure 18-6 shows the Lorenz curves for Islandia and Syldavia.
-Refer to Figure 18-6.Which country has the more unequal distribution of income?
Figure 18-6 shows the Lorenz curves for Islandia and Syldavia.
-Refer to Figure 18-6.Which country has the more unequal distribution of income?
Free
(Multiple Choice)
4.7/5 (40)
Correct Answer:Verified
B
Income inequality increases as the Gini coefficient approaches 1.
Free
(True/False)
4.8/5 (36)
Correct Answer:Verified
True
Public schools in the United States get most of their operating funds from
(Multiple Choice)
4.8/5 (27)
The largest percentage of federal income tax revenue in the United States is paid by the
(Multiple Choice)
4.8/5 (39)
Table 18-5
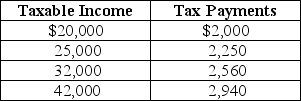 Table 18-5 shows the amount of taxes paid on various levels of income.
-Refer to Table 18-5.The tax system is
Table 18-5 shows the amount of taxes paid on various levels of income.
-Refer to Table 18-5.The tax system is
(Multiple Choice)
4.8/5 (37)
A proportional tax is a tax for which people with lower incomes
(Multiple Choice)
4.9/5 (41)
Most economists agree that some of the burden of the corporate income tax
(Multiple Choice)
4.7/5 (27)
If official poverty statistics for the United States included transfer payments individuals receive from the government, such as Social Security payments and other non-cash benefits such as food stamps
(Multiple Choice)
4.8/5 (37)
If the government wants to minimize the welfare loss of a tax, it should tax goods with more inelastic demand curves or supply curves.
(True/False)
4.8/5 (32)
Figure 18-9
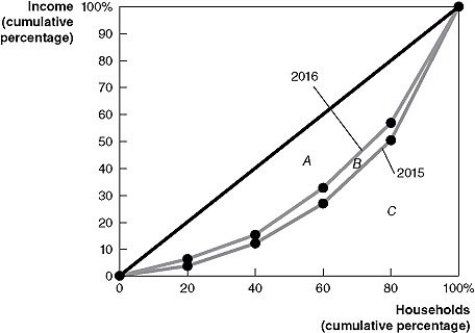 -Refer to Figure 18-9 to answer the following questions.
a.Did the distribution of income become more equal in 2016 that it was in 2015, or did it become less equal? Explain.
b.If area A = 1,600, area B = 200, and area C = 3,200, calculate the Gini coefficient for 2015 and the Gini coefficient for 2016.
-Refer to Figure 18-9 to answer the following questions.
a.Did the distribution of income become more equal in 2016 that it was in 2015, or did it become less equal? Explain.
b.If area A = 1,600, area B = 200, and area C = 3,200, calculate the Gini coefficient for 2015 and the Gini coefficient for 2016.
(Essay)
4.7/5 (33)
Interest paid on home mortgages is deductible from individual income taxes.When comparing home owners and renters, the mortgage interest deduction is an example of
(Multiple Choice)
4.8/5 (31)
When considering changes in tax policy, economists usually focus on
(Multiple Choice)
4.9/5 (25)
The horizontal-equity principle of taxation is not easy to use in practice because
(Multiple Choice)
4.8/5 (35)
Figure 18-2
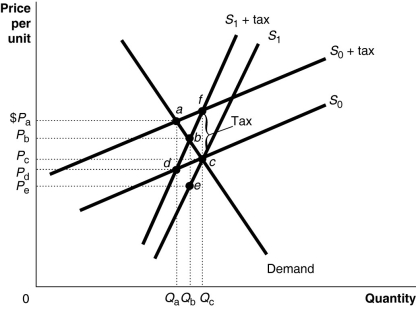 Figure 18-2 shows a demand curve and two sets of supply curves, one set more elastic than the other.
-Refer to Figure 18-2.If the government imposes an excise tax of $1.00 on every unit sold,
Figure 18-2 shows a demand curve and two sets of supply curves, one set more elastic than the other.
-Refer to Figure 18-2.If the government imposes an excise tax of $1.00 on every unit sold,
(Multiple Choice)
4.9/5 (41)
Compare the distribution of income in the United States with the distribution of income in other high-income countries.
(Essay)
4.8/5 (43)
Table 18-1
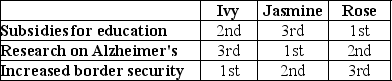 Suppose $1 billion is available in the budget and Congress is considering allocating the funds to one of the following three alternatives: 1)Subsidies for education, 2)Research on Alzheimer's or 3)Increased border security. Table 18-1 shows three voters' rankings of the alternatives.
-Refer to Table 18-1.Suppose a series of votes are taken in which each pair of alternatives is considered in turn.If the vote is between allocating funds to education subsidies and increased border security,
Suppose $1 billion is available in the budget and Congress is considering allocating the funds to one of the following three alternatives: 1)Subsidies for education, 2)Research on Alzheimer's or 3)Increased border security. Table 18-1 shows three voters' rankings of the alternatives.
-Refer to Table 18-1.Suppose a series of votes are taken in which each pair of alternatives is considered in turn.If the vote is between allocating funds to education subsidies and increased border security,
(Multiple Choice)
4.9/5 (37)
Figure 18-1
-Refer to Figure 18-1.The sales tax revenue collected by the government is represented by the area
(Multiple Choice)
4.9/5 (29)
Filters
- Essay(0)
- Multiple Choice(0)
- Short Answer(0)
- True False(0)
- Matching(0)