Exam 9: Comparative Advantage and the Gains From International Trade
Exam 1: Economics: Foundations and Models240 Questions
Exam 2: Trade-Offs, Comparative Advantage, and the Market System258 Questions
Exam 3: Where Prices Come From: the Interaction of Demand and Supply242 Questions
Exam 4: Economic Efficiency, Government Price Setting, and Taxes208 Questions
Exam 5: Externalities, Environmental Policy, and Public Goods262 Questions
Exam 6: Elasticity: the Responsiveness of Demand and Supply293 Questions
Exam 7: The Economics of Health Care171 Questions
Exam 8: Firms, the Stock Market, and Corporate Governance261 Questions
Exam 9: Comparative Advantage and the Gains From International Trade188 Questions
Exam 10: Consumer Choice and Behavioral Economics304 Questions
Exam 11: Technology, Production, and Costs327 Questions
Exam 12: Firms in Perfectly Competitive Markets297 Questions
Exam 13: Monopolistic Competition: the Competitive Model in a272 Questions
Exam 14: Oligopoly: Firms in Less Competitive Markets257 Questions
Exam 15: Monopoly and Antitrust Policy279 Questions
Exam 16: Pricing Strategy258 Questions
Exam 17: The Markets for Labor and Other Factors of Production279 Questions
Exam 18: Public Choice, Taxes, and the Distribution of Income258 Questions
Select questions type
Figure 9-1
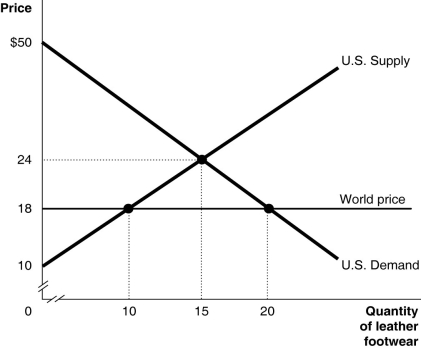 Figure 9-1 shows the U.S. demand and supply for leather footwear.
-Refer to Figure 9-1.Under autarky, the deadweight loss is
Figure 9-1 shows the U.S. demand and supply for leather footwear.
-Refer to Figure 9-1.Under autarky, the deadweight loss is
(Multiple Choice)
4.7/5  (35)
(35)
Which of the following statements is used to justify protectionism?
(Multiple Choice)
4.8/5 (35)
Figure 9-2
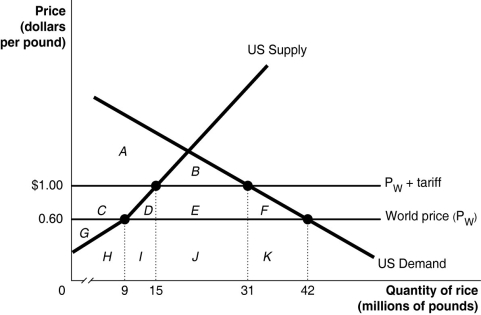 Suppose the U.S. government imposes a $0.40 per pound tariff on rice imports. Figure 9-2 shows the impact of this tariff.
-Refer to Figure 9-2.Without the tariff in place, the United States produces
Suppose the U.S. government imposes a $0.40 per pound tariff on rice imports. Figure 9-2 shows the impact of this tariff.
-Refer to Figure 9-2.Without the tariff in place, the United States produces
(Multiple Choice)
4.7/5 (38)
Table 9-6
Output per hour Production and Production
of work Consumption without Trade with Trade
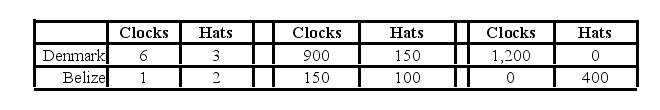 Denmark and Belize can produce both clocks and hats. Each country has a total of 200 available labor hours for the production of clocks and hats. Table 9-6 shows the output per hour of work, the production and consumption quantities without trade, and the production numbers with trade.
-Refer to Table 9-6.All of the following are terms of trade that could possibly benefit both countries except
Denmark and Belize can produce both clocks and hats. Each country has a total of 200 available labor hours for the production of clocks and hats. Table 9-6 shows the output per hour of work, the production and consumption quantities without trade, and the production numbers with trade.
-Refer to Table 9-6.All of the following are terms of trade that could possibly benefit both countries except
(Multiple Choice)
4.9/5 (38)
The "Buy American" provision in the 2009 stimulus package required that stimulus money be spent only on U.S.-made goods, effectively acting as a quota of zero imports when stimulus money was being spent.In the U.S.steel market, the "Buy American" provision in the 2009 stimulus package would
(Multiple Choice)
4.9/5 (37)
Jobs lost to foreign trade are generally easy to identify, but jobs created by foreign trade are generally less easy to identify.
(True/False)
4.9/5 (38)
Figure 9-2
Suppose the U.S. government imposes a $0.40 per pound tariff on rice imports. Figure 9-2 shows the impact of this tariff.
-Refer to Figure 9-2.As a result of the tariff, domestic producers increase their quantity supplied by
(Multiple Choice)
4.8/5 (37)
Table 9-6
Output per hour Production and Production
of work Consumption without Trade with Trade
Denmark and Belize can produce both clocks and hats. Each country has a total of 200 available labor hours for the production of clocks and hats. Table 9-6 shows the output per hour of work, the production and consumption quantities without trade, and the production numbers with trade.
-Refer to Table 9-6.With trade, what is the total gain in hat production?
(Multiple Choice)
5.0/5 (43)
Trade only occurs if all individuals win, and no individuals lose, as a result of the trade.
(True/False)
4.7/5 (42)
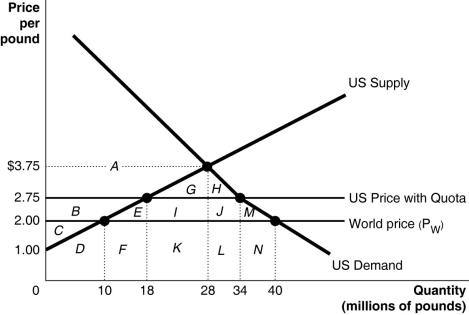
Figure 9-5
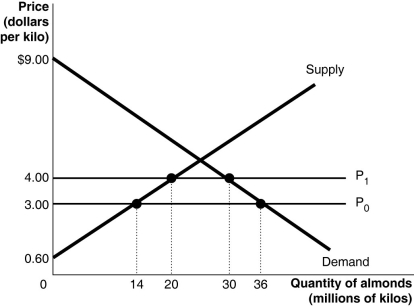 Bragabong currently both produces and imports almonds. The government of Bragabong decides to restrict international trade in almonds by imposing a quota that allows imports of only 10 million kilos each year. Figure 9-5 shows the estimated demand and supply curves for almonds in Bragabong and the results of imposing the quota.
-Use Figure 9-5 to answer questions a-j.
a.If there is no quota what is the domestic price of almonds and what is the quantity of almonds demanded by consumers?
b.If there is no quota how many kilos of almonds would domestic producers supply and what quantity would be imported?
c.If there is no quota what is the dollar value of consumer surplus?
d.If there is no quota what is the dollar value of producer surplus received by producers in Bragabong?
e.If there is no quota what is the revenue received by foreign producers who supply almonds to Bragabong?
f.With a quota in place what is the price that consumers of Bragabong must now pay and what is the quantity demanded?
g.With a quota in place what is the dollar value of consumer surplus? Are consumers better off?
h.With a quota in place what is the dollar value of producer surplus received by producers in Bragabong? Are domestic producers better off?
i.Calculate the revenue to foreign producers who are granted permission to sell in Bragabong after the imposition of the quota.
j.Calculate the deadweight loss as a result of the quota.
Bragabong currently both produces and imports almonds. The government of Bragabong decides to restrict international trade in almonds by imposing a quota that allows imports of only 10 million kilos each year. Figure 9-5 shows the estimated demand and supply curves for almonds in Bragabong and the results of imposing the quota.
-Use Figure 9-5 to answer questions a-j.
a.If there is no quota what is the domestic price of almonds and what is the quantity of almonds demanded by consumers?
b.If there is no quota how many kilos of almonds would domestic producers supply and what quantity would be imported?
c.If there is no quota what is the dollar value of consumer surplus?
d.If there is no quota what is the dollar value of producer surplus received by producers in Bragabong?
e.If there is no quota what is the revenue received by foreign producers who supply almonds to Bragabong?
f.With a quota in place what is the price that consumers of Bragabong must now pay and what is the quantity demanded?
g.With a quota in place what is the dollar value of consumer surplus? Are consumers better off?
h.With a quota in place what is the dollar value of producer surplus received by producers in Bragabong? Are domestic producers better off?
i.Calculate the revenue to foreign producers who are granted permission to sell in Bragabong after the imposition of the quota.
j.Calculate the deadweight loss as a result of the quota.
(Essay)
4.7/5 (37)
What are the four main sources of comparative advantage? Briefly explain each source and provide examples.
(Essay)
4.9/5 (33)
In 1995 ________, which was established in 1948, was replaced by ________.
(Multiple Choice)
4.7/5 (43)
A consequence of increasing marginal costs of producing digital music players in Japan is
(Multiple Choice)
4.9/5 (35)
The concept of ________ explains how trade between two countries can make each better off.
(Multiple Choice)
4.9/5 (29)
If Estonia has an absolute advantage in the production of two goods compared to Norway, Estonia cannot benefit from trade with Norway.
(True/False)
4.8/5 (37)
Disagreements about whether the U.S.government should regulate international trade
(Multiple Choice)
4.8/5 (46)
Table 9-2
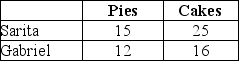 Sarita and Gabriel own S&G Bakery. Table 9-2 lists the number of pies and cakes Sarita and Gabriel can each bake in one day.
-Refer to Table 9-2.Select the statement that accurately interprets the data in the table.
Sarita and Gabriel own S&G Bakery. Table 9-2 lists the number of pies and cakes Sarita and Gabriel can each bake in one day.
-Refer to Table 9-2.Select the statement that accurately interprets the data in the table.
(Multiple Choice)
4.8/5 (36)
Figure 9-3
 Since 1953 the United States has imposed a quota to limit the imports of peanuts. Figure 9-3 illustrates the impact of the quota.
-Refer to Figure 9-3.What is the area of domestic producer surplus without a quota?
Since 1953 the United States has imposed a quota to limit the imports of peanuts. Figure 9-3 illustrates the impact of the quota.
-Refer to Figure 9-3.What is the area of domestic producer surplus without a quota?
(Multiple Choice)
4.8/5 (32)
Filters
- Essay(0)
- Multiple Choice(0)
- Short Answer(0)
- True False(0)
- Matching(0)