Exam 4: B: Supply and Demand: Applications and Extensions
Exam 1: The Economic Approach210 Questions
Exam 2: A: Some Tools of the Economist224 Questions
Exam 2: B: Some Tools of the Economist33 Questions
Exam 3: A: Supply, Demand, and the Market Process225 Questions
Exam 3: B: Supply, Demand, and the Market Process180 Questions
Exam 4: A: Supply and Demand: Applications and Extensions233 Questions
Exam 4: B: Supply and Demand: Applications and Extensions98 Questions
Exam 5: Difficult Cases for the Market and the Role of Government168 Questions
Exam 6: The Economics of Collective Decision-Making180 Questions
Exam 7: Consumer Choice and Elasticity223 Questions
Exam 8: A: Costs and the Supply of Goods223 Questions
Exam 8: B: Costs and the Supply of Goods8 Questions
Exam 9: A: Price Takers and the Competitive Process237 Questions
Exam 9: B: Price Takers and the Competitive Process23 Questions
Exam 10: Price-Searcher Markets With Low Entry Barriers216 Questions
Exam 11: A: Price-Searcher Markets With High Entry Barriers229 Questions
Exam 11: B: Price-Searcher Markets With High Entry Barriers25 Questions
Exam 12: The Supply of and Demand for Productive Resources200 Questions
Exam 13: Earnings, Productivity, and the Job Market109 Questions
Exam 14: Investment, the Capital Market, and the Wealth of Nations129 Questions
Exam 15: Income Inequality and Poverty136 Questions
Exam 16: Appendix: Government Spending and Taxation79 Questions
Exam 17: Appendix: the Economics of Social Security54 Questions
Exam 18: Appendix: the Stock Market: Its Function, Performance, and Potential As an Investment Opportunity70 Questions
Exam 19: Appendix: Great Debates in Economics: Keynes Versus Hayek8 Questions
Exam 20: Appendix: the Crisis of 2008: Causes and Lessons for the Future64 Questions
Exam 21: Appendix: Lessons From the Great Depression60 Questions
Exam 22: Appendix: the Economics of Healthcare68 Questions
Exam 23: Appendix:education: Problems and Performance60 Questions
Exam 24: Appendix: Earnings Differences Between Men and Women47 Questions
Exam 26: Appendix: the Question of Resource Exhaustion61 Questions
Exam 25: Appendix: Do Labor Unions Increase the Wages of Workers74 Questions
Exam 27: Appendix: Difficult Environmental Cases and the Role of Government63 Questions
Select questions type
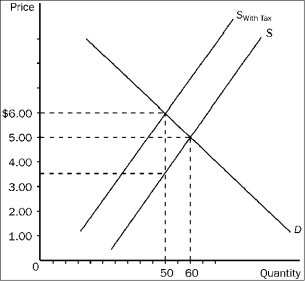
Figure 4-25
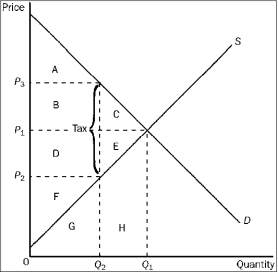 -Refer to Figure 4-25. The tax causes a reduction in producer surplus that is represented by area
(Multiple Choice)
4.9/5  (32)
(32)
An increase in the demand for a product will cause output to
(Multiple Choice)
4.9/5 (27)
When a government subsidy is granted to the buyers of a product, sellers can end up capturing some of the benefit because
(Multiple Choice)
4.8/5 (45)
During the imposition of price controls in the 1970s, long gasoline lines were common. In the absence of price controls, markets would have eliminated such excess demand by
(Multiple Choice)
4.9/5 (32)
Figure 4-25
-Refer to Figure 4-25. After the tax is levied, producer surplus is represented by area
(Multiple Choice)
4.9/5 (38)
Figure 4-25
-Refer to Figure 4-25. Consumer surplus before the tax was levied is represented by area
(Multiple Choice)
4.8/5 (36)
Figure 4-18
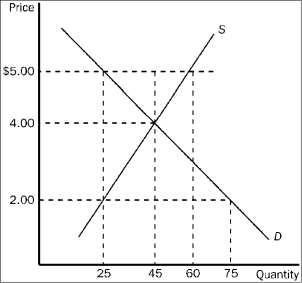 -Refer to Figure 4-18. If the government imposes a price ceiling of $2.00 in this market, the result is a
(Multiple Choice)
4.7/5 (31)
Government programs such as Medicare substantially subsidize health care purchases by some consumers in the U.S. economy. Who benefits from these subsidies? How do they affect the price of health care? If you are not a recipient of this program, are you made better or worse off by the subsidy? Explain.
(Essay)
4.7/5 (36)
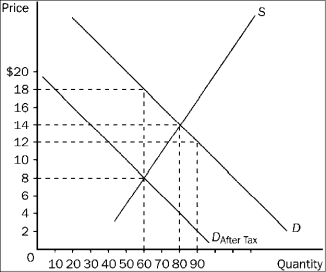
Figure 4-15
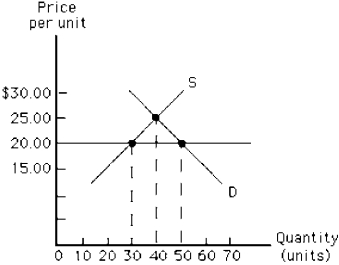 -In Figure 4-15, suppose a price floor is established at $20.00. What is the result?
(Multiple Choice)
4.9/5 (35)
Figure 4-14
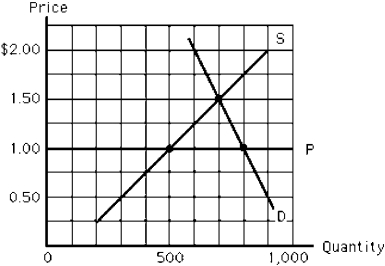 -Figure 4-14 depicts the milk market. The horizontal line, P, represents a price ceiling imposed by the government. Which of the following is true?
(Multiple Choice)
4.7/5 (36)
Bill the butcher is upset because the government plans to tax beef $.10 a pound. "I hate paying taxes," he says. "Because of this, I'm raising all my beef prices by $.10 a pound. The consumers will bear this burden, not me." Do you see anything wrong with this way of thinking? Explain.
(Essay)
5.0/5 (37)
Currently, federal and state gasoline taxes (imposed statutorily on the sellers of gasoline) amount to about $.45 per gallon. Suppose the current price of gasoline is $1.20 per gallon, and that if the tax was not in place, the price would be only $.80.
(Multiple Choice)
4.7/5 (40)
In the mid-1940s, the marginal income tax rate in the top income tax bracket was 94 percent. In the 1960s, the top rate was lowered to 70 percent, and in the 1980s, the top rate was again lowered to 28 percent. The data show that as a result of these tax rate reductions, tax revenue (particularly from the rich) increased. This is consistent with the idea illustrated with the
(Multiple Choice)
4.9/5 (37)
Suppose the United Auto Workers union obtains a substantial wage increase for auto workers. How will this affect the market for automobiles?
(Essay)
4.8/5 (44)
Figure 4-21
 -Refer to Figure 4-21. The price paid by buyers after the tax is imposed is
(Multiple Choice)
4.8/5 (46)
Figure 4-20
 -Refer to Figure 4-20. The equilibrium price in the market before the tax is imposed is
(Multiple Choice)
4.9/5 (34)
Figure 4-19
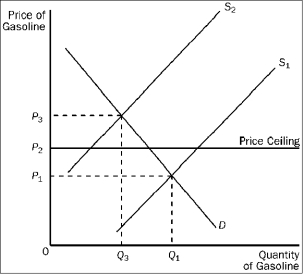 -Refer to Figure 4-19. When the price ceiling applies in this market and the supply curve for gasoline shifts from S₁ to S₂, the resulting quantity of gasoline that is bought and sold is
(Multiple Choice)
4.8/5 (38)
Figure 4-22
 -Refer to Figure 4-22. Buyers pay how much of the tax per unit?
(Multiple Choice)
4.9/5 (41)
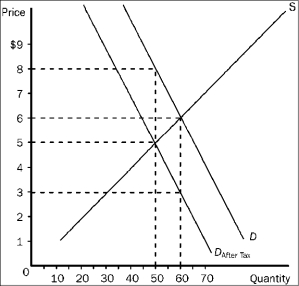
Figure 4-17
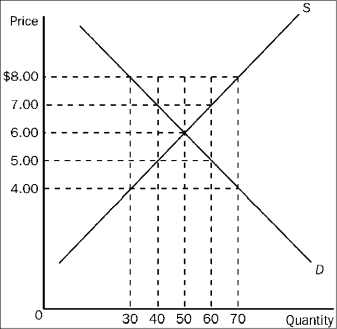 -Refer to Figure 4-17. Suppose a price floor of $7.00 is imposed. As a result,
(Multiple Choice)
4.8/5 (38)
Filters
- Essay(0)
- Multiple Choice(0)
- Short Answer(0)
- True False(0)
- Matching(0)