Exam 11: Output and Costs
Exam 1: What Is Economics212 Questions
Exam 2: The Economic Problem159 Questions
Exam 3: Demand and Supply197 Questions
Exam 4: Elasticity186 Questions
Exam 5: Efficiency and Equity119 Questions
Exam 6: Governments Actions in Markets130 Questions
Exam 7: Global Markets in Action138 Questions
Exam 8: Utility and Demand120 Questions
Exam 9: Possibilities, Preferences, and Choices124 Questions
Exam 10: Organizing Production111 Questions
Exam 11: Output and Costs142 Questions
Exam 12: Perfect Competition117 Questions
Exam 13: Monopoly118 Questions
Exam 14: Monopolistic Competition122 Questions
Exam 15: Oligopoly106 Questions
Exam 16: Externalities116 Questions
Exam 17: Public Goods and Common Resources98 Questions
Exam 18: Markets for Factors of Production128 Questions
Exam 19: Economic Inequality124 Questions
Exam 20: Measuring Gdp and Economic Growth133 Questions
Exam 21: Monitoring Jobs and Inflation121 Questions
Exam 22: Economic Growth98 Questions
Exam 23: Finance, Saving, and Investment141 Questions
Exam 24: Money, the Price Level, and Inflation126 Questions
Exam 25: The Exchange Rate and the Balance of Payments126 Questions
Exam 26: Aggregate Supply and Aggregate Demand136 Questions
Exam 27: Expenditure Multipliers171 Questions
Exam 28: The Business Cycle, Inflation, and Deflation110 Questions
Exam 29: Fiscal Policy97 Questions
Exam 30: Monetary Policy97 Questions
Exam 31: Macro Only: International Trade Policy126 Questions
Select questions type
Use the figure below to answer the following questions.
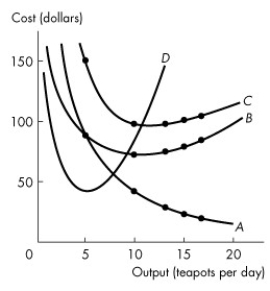 Figure 11.3.2
-Refer to Figure 11.3.2, which illustrates the short-run average and marginal cost curves. The marginal cost curve is curve
Figure 11.3.2
-Refer to Figure 11.3.2, which illustrates the short-run average and marginal cost curves. The marginal cost curve is curve
(Multiple Choice)
4.8/5  (29)
(29)
Use the figure below to answer the following questions.
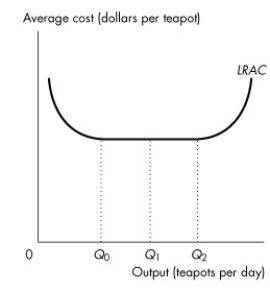 Figure 11.4.4
-Refer to Figure 11.4.4, which illustrates the long-run average total cost curve. Given an increase in output from Q₁ to Q₂,
Figure 11.4.4
-Refer to Figure 11.4.4, which illustrates the long-run average total cost curve. Given an increase in output from Q₁ to Q₂,
(Multiple Choice)
4.9/5 (46)
Suppose a 1-unit increase in labour, from 2 to 3 workers, increases output from 10 to 15 tea cups. The marginal product from the increase in the quantity of labour is
(Multiple Choice)
4.8/5 (42)
Use the figure below to answer the following questions.
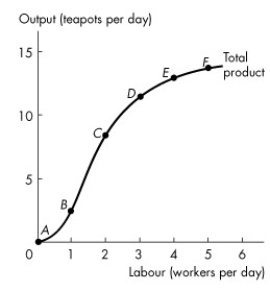 Figure 11.2.1
-Refer to Figure 11.2.1 which illustrates Tania's total product curve. Which one of the following statements is false?
Figure 11.2.1
-Refer to Figure 11.2.1 which illustrates Tania's total product curve. Which one of the following statements is false?
(Multiple Choice)
4.9/5 (47)
Use the table below to answer the following questions.
Table 11.2.2
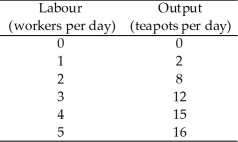 -Refer to Table 11.2.2 which gives Tania's total product schedule. The marginal product when the number of workers increases from 2 to 3 is
(Multiple Choice)
4.9/5 (38)
Use the figure below to answer the following questions.
Figure 11.2.1
-Refer to Figure 11.2.1 which illustrates Tania's total product curve. Marginal product of labour reaches its maximum when the number of workers increases from
(Multiple Choice)
4.7/5 (34)
Diseconomies of scale refer to the range of output over which
(Multiple Choice)
5.0/5 (33)
When the marginal product of labour is less than the average product of labour,
(Multiple Choice)
4.9/5 (35)
Use the figure below to answer the following question.
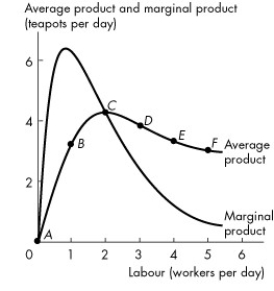 Figure 11.2.2
-Refer to Figure 11.2.2 which shows Tania's average product curve and marginal product curve. The point of maximum average product is point
Figure 11.2.2
-Refer to Figure 11.2.2 which shows Tania's average product curve and marginal product curve. The point of maximum average product is point
(Multiple Choice)
4.8/5 (38)
Which of the following quotes best illustrates the idea of marginal product?
(Multiple Choice)
4.9/5 (36)
Use the table below to answer the following questions.
Table 11.4.1
Swanky's output levels
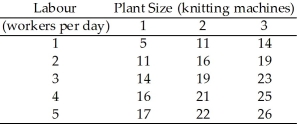 -Refer to Table 11.4.1, which represents Swanky's production possibilities as the firm varies the quantities of knitting machines and workers per day. If Swanky increases the number of knitting machines from 1 to 2 and increases the number of workers employed from 1 to 2, the factory experiences
(Multiple Choice)
4.8/5 (36)
Consider a graph that shows the total cost curve and the total variable cost curve. As output increases, the vertical distance between these two curves
(Multiple Choice)
5.0/5 (43)
Use the table below to answer the following questions.
Table 11.3.1
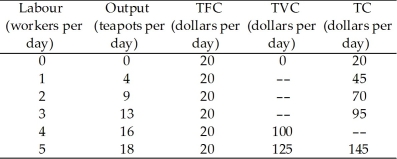 -Refer to Table 11.3.1, which gives Tania's total cost schedule. The average total cost of producing 16 teapots per day is
(Multiple Choice)
4.9/5 (41)
A technological advance will shift (1)TP, AP, and MP curves up.
(2)TP, AP, and MP down.
(3)TC, ATC, and MC curves up.
(4)TC, ATC, and MC curves down.
(Multiple Choice)
4.9/5 (48)
Use the information below to answer the following question.
Fact 11.1.2 A Bakery on the Rise
Some 500 customers a day line up to buy Avalon's breads, scones, muffins, and coffee. Staffing and management are worries. Avalon now employs 35 and plans to hire 15 more. Its payroll will climb by 30 percent to 40 percent. The new CEO has executed an ambitious agenda that includes the move to a larger space, which will increase the rent from $3,500 to $10,000 a month.
Source: Fortune, April 14, 2008
-Refer to Fact 11.1.2. Avalon's decision to ________ is a short-run decision. Avalon's decision to ________ is a long-run decision.
(Multiple Choice)
4.8/5 (41)
Filters
- Essay(0)
- Multiple Choice(0)
- Short Answer(0)
- True False(0)
- Matching(0)