Exam 26: Aggregate Supply and Aggregate Demand
Exam 1: What Is Economics212 Questions
Exam 2: The Economic Problem159 Questions
Exam 3: Demand and Supply198 Questions
Exam 20: Measuring Gdp and Economic Growth133 Questions
Exam 21: Monitoring Jobs and Inflation121 Questions
Exam 22: Economic Growth98 Questions
Exam 23: Finance, Saving, and Investment141 Questions
Exam 24: Money, the Price Level, and Inflation126 Questions
Exam 25: The Exchange Rate and the Balance of Payments126 Questions
Exam 26: Aggregate Supply and Aggregate Demand136 Questions
Exam 27: Expenditure Multipliers171 Questions
Exam 28: The Business Cycle, Inflation, and Deflation110 Questions
Exam 29: Fiscal Policy97 Questions
Exam 30: Monetary Policy97 Questions
Exam 31: International Trade Policy126 Questions
Select questions type
Figure 26.2.1
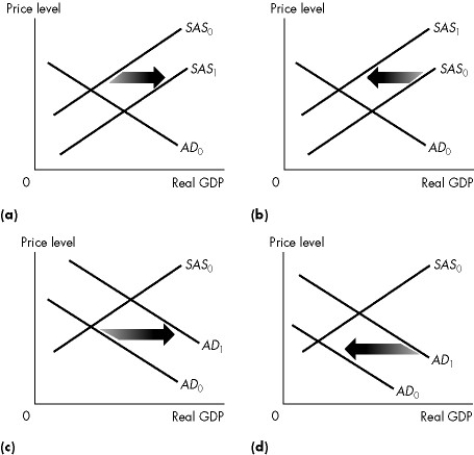 -Refer to Figure 26.2.1. Which graph illustrates what happens when the quantity of money increases?
(Multiple Choice)
4.9/5  (33)
(33)
We observe an increase in the price level and an increase in real GDP. Which of the following is a possible explanation?
(Multiple Choice)
5.0/5 (25)
Beginning at a long-run equilibrium, an increase in aggregate demand
(Multiple Choice)
4.8/5 (32)
Toyota and Honda build additional plants in Canada. This event ________ short-run aggregate supply and ________ long-run aggregate supply.
(Multiple Choice)
4.8/5 (34)
Figure 26.3.1
 -Refer to Figure 26.3.1. Consider statements (1)and (2)and select the correct answer. (1) The actual unemployment rate exceeds the natural unemployment rate.
(2) Short-run aggregate supply will automatically shift leftward as the economy adjusts to long-run equilibrium.
-Refer to Figure 26.3.1. Consider statements (1)and (2)and select the correct answer. (1) The actual unemployment rate exceeds the natural unemployment rate.
(2) Short-run aggregate supply will automatically shift leftward as the economy adjusts to long-run equilibrium.
(Multiple Choice)
4.8/5 (34)
Which one of the following shifts the aggregate demand curve leftward?
(Multiple Choice)
4.8/5 (40)
Figure 26.3.3
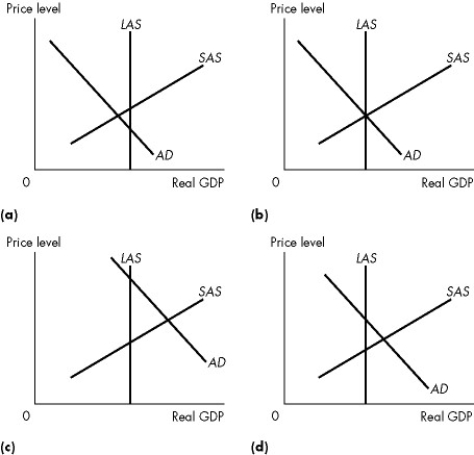 -Refer to Figure 26.3.3. Which one of the graphs illustrates a full-employment equilibrium?
(Multiple Choice)
4.8/5 (32)
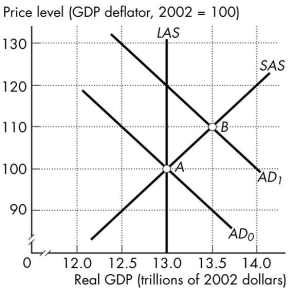
Figure 26.3.4
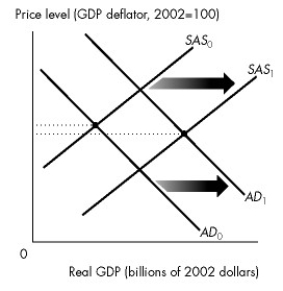 -Refer to Figure 26.3.4. The changes represented
(Multiple Choice)
4.9/5 (35)
Figure 26.3.1
-Refer to Figure 26.3.1. Consider statements (1)and (2)and select the correct answer. (1) The economy of Econoworld is experiencing an above full-employment equilibrium.
(2) SAS will automatically shift rightward as the economy adjusts to long-run equilibrium.
(Multiple Choice)
4.8/5 (26)
A ________ macroeconomist believes that the economy is self-regulating and always at full employment. A ________ macroeconomist believes the economy requires active help from fiscal policy and monetary policy to maintain full employment.
(Multiple Choice)
4.8/5 (27)
The quantity of real GDP demanded is the sum of real consumption expenditure (C), investment (I),
(Multiple Choice)
4.8/5 (29)
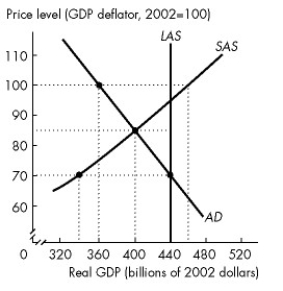
Figure 26.3.1
-Refer to Figure 26.3.1. When the economy of Econoworld is in short-run macroeconomic equilibrium, the price level is
(Multiple Choice)
4.8/5 (34)
Figure 26.3.2
 -Refer to Figure 26.3.2. As the economy of Mythlo automatically adjusts to long-run equilibrium, the
(Multiple Choice)
4.9/5 (35)
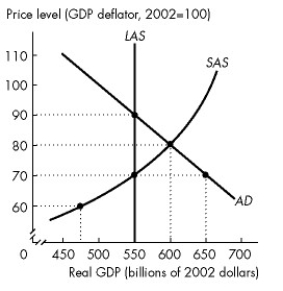
Table 26.3.3
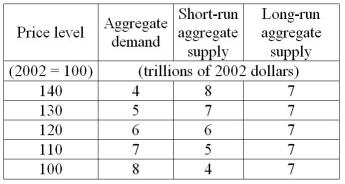 -Refer to Table 26.3.3. When the economy is at its short-run macroeconomic equilibrium, the price level is
(Multiple Choice)
4.8/5 (37)
Figure 26.3.5
 -Refer to Figure 26.3.5. When the economy is at full employment, real GDP is
(Multiple Choice)
4.8/5 (40)
Filters
- Essay(0)
- Multiple Choice(0)
- Short Answer(0)
- True False(0)
- Matching(0)