Exam 26: Aggregate Supply and Aggregate Demand
Exam 1: What Is Economics212 Questions
Exam 2: The Economic Problem159 Questions
Exam 3: Demand and Supply198 Questions
Exam 20: Measuring Gdp and Economic Growth133 Questions
Exam 21: Monitoring Jobs and Inflation121 Questions
Exam 22: Economic Growth98 Questions
Exam 23: Finance, Saving, and Investment141 Questions
Exam 24: Money, the Price Level, and Inflation126 Questions
Exam 25: The Exchange Rate and the Balance of Payments126 Questions
Exam 26: Aggregate Supply and Aggregate Demand136 Questions
Exam 27: Expenditure Multipliers171 Questions
Exam 28: The Business Cycle, Inflation, and Deflation110 Questions
Exam 29: Fiscal Policy97 Questions
Exam 30: Monetary Policy97 Questions
Exam 31: International Trade Policy126 Questions
Select questions type
Suppose that the E.U. economy goes into an expansion. Canadian real GDP ________ and Canadian unemployment ________ in the short run.
(Multiple Choice)
4.8/5  (38)
(38)
Figure 26.2.1
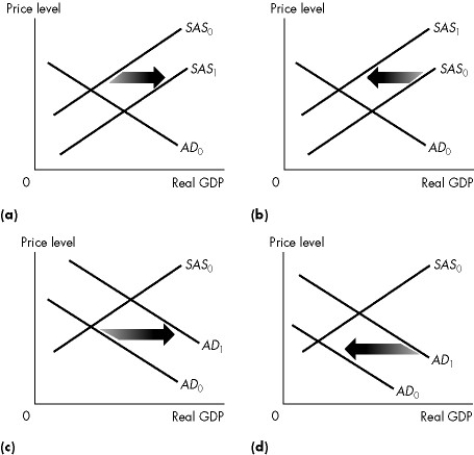 -Refer to Figure 26.2.1. Which graph illustrates what happens when the quantity of money decreases?
(Multiple Choice)
4.8/5 (29)
Everything else remaining the same, an increase in the interest rate increases saving and
(Multiple Choice)
4.9/5 (35)
Which of the following statements about the monetarist view of the macroeconomy is incorrect?
(Multiple Choice)
4.8/5 (30)
Figure 26.3.2
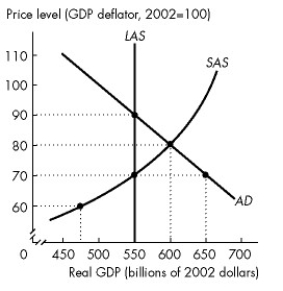 -Refer to Figure 26.3.2. When the economy of Mythlo is in short-run macroeconomic equilibrium, the price level is
(Multiple Choice)
4.7/5 (29)
Figure 26.3.2
-Refer to Figure 26.3.2. Consider statements (1)and (2)and select the correct answer. (1) The actual unemployment rate exceeds the natural unemployment rate in the short run.
(2) SAS automatically shifts rightward as the economy adjusts to long-run equilibrium.
(Multiple Choice)
4.7/5 (39)
Figure 26.3.3
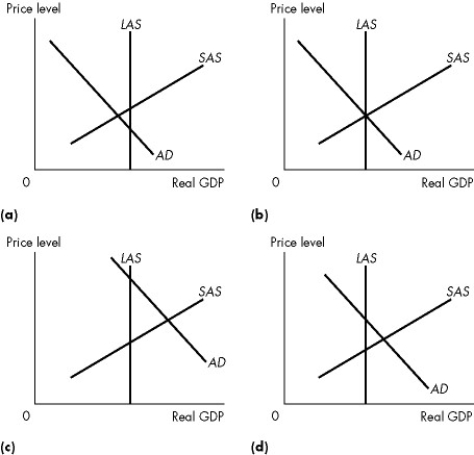 -Refer to Figure 26.3.3. Which one of the graphs illustrates a below full-employment equilibrium?
(Multiple Choice)
4.9/5 (37)
Table 26.3.3
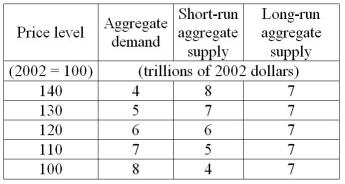 -Refer to Table 26.3.3. With no interference from the central bank or the government, the
(Multiple Choice)
4.9/5 (33)
Figure 26.2.1
-Refer to Figure 26.2.1. Which graph illustrates what happens when government expenditure decreases?
(Multiple Choice)
4.8/5 (36)
Figure 26.3.1
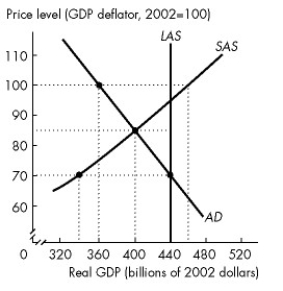 -Refer to Figure 26.3.1. Econoworld is at its short-run macroeconomic equilibrium. There is a difference between ________ real GDP and potential GDP of $________ billion.
(Multiple Choice)
4.7/5 (39)
Everything else remaining the same, an increase in the expected inflation rate
(Multiple Choice)
4.7/5 (30)
Consider the following events: Event 1: Growth in the world economy slows.
Event 2: The world price of oil rises.
Event 3: Canadian labour productivity declines.
Choose the statement that is correct.
(Multiple Choice)
4.7/5 (30)
Filters
- Essay(0)
- Multiple Choice(0)
- Short Answer(0)
- True False(0)
- Matching(0)