Exam 26: Aggregate Supply and Aggregate Demand
Exam 1: What Is Economics212 Questions
Exam 2: The Economic Problem159 Questions
Exam 3: Demand and Supply198 Questions
Exam 20: Measuring Gdp and Economic Growth133 Questions
Exam 21: Monitoring Jobs and Inflation121 Questions
Exam 22: Economic Growth98 Questions
Exam 23: Finance, Saving, and Investment141 Questions
Exam 24: Money, the Price Level, and Inflation126 Questions
Exam 25: The Exchange Rate and the Balance of Payments126 Questions
Exam 26: Aggregate Supply and Aggregate Demand136 Questions
Exam 27: Expenditure Multipliers171 Questions
Exam 28: The Business Cycle, Inflation, and Deflation110 Questions
Exam 29: Fiscal Policy97 Questions
Exam 30: Monetary Policy97 Questions
Exam 31: International Trade Policy126 Questions
Select questions type
Foreign exchange dealers expect the Canadian dollar next year to appreciate against all currencies. What is the effect on the quantity of real GDP demanded or aggregate demand in Canada?
(Multiple Choice)
4.8/5  (28)
(28)
If a change in wealth is induced by a change in the price level, then this would be shown as a
(Multiple Choice)
4.7/5 (26)
Which of the following situations illustrates how monetary policy can influence aggregate demand?
(Multiple Choice)
4.9/5 (28)
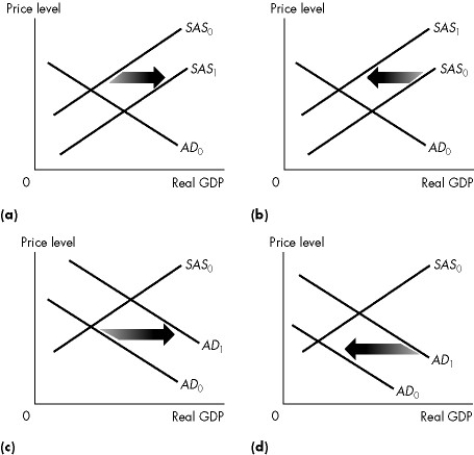
Figure 26.1.1
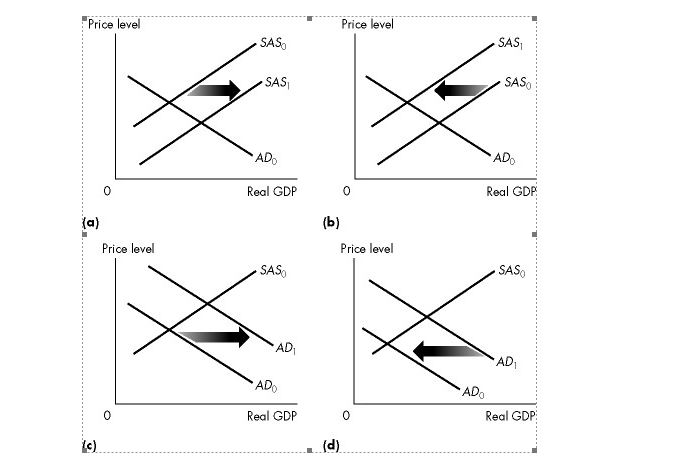 -Refer to Figure 26.1.1. Which graph illustrates what happens when factor prices rise?
(Multiple Choice)
4.9/5 (27)
Which of the following does not change short-run aggregate supply?
(Multiple Choice)
4.7/5 (32)
Which one of the following variables can change without creating a shift of the aggregate demand curve?
(Multiple Choice)
4.9/5 (43)
Figure 26.3.1
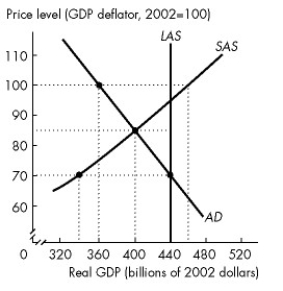 -Refer to Figure 26.3.1. If Econoworld automatically adjusts to a long-run equilibrium, then in the long-run macroeconomic equilibrium,
(Multiple Choice)
5.0/5 (31)
If factor prices remain constant, an increase in aggregate demand
(Multiple Choice)
4.9/5 (36)
Figure 26.3.1
-Refer to Figure 26.3.1. Short-run macroeconomic equilibrium real GDP in Econoworld is
(Multiple Choice)
4.8/5 (39)
Everything else remaining the same, the short-run aggregate supply curve shifts rightward if
(Multiple Choice)
4.8/5 (35)
An increase in oil prices to a country that is a net importer of oil shifts
(Multiple Choice)
4.7/5 (34)
Figure 26.1.1
-Refer to Figure 26.1.1. Which graph illustrates what happens when factor prices decrease?
(Multiple Choice)
4.9/5 (32)
Everything else remaining the same, which one of the following increases aggregate demand?
(Multiple Choice)
5.0/5 (38)
When the actual unemployment rate is equal to the natural unemployment rate, then the
(Multiple Choice)
4.9/5 (29)
Which one of the following is a reason for the negative slope of the aggregate demand curve?
(Multiple Choice)
4.8/5 (35)
Figure 26.3.3
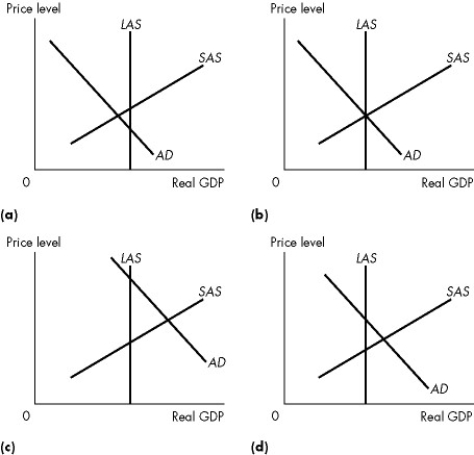 -Refer to Figure 26.3.3. Which of the graphs illustrates an above full-employment equilibrium?
(Multiple Choice)
4.9/5 (28)
Suppose there is an increase in the quantity of capital. As a result, the SAS
(Multiple Choice)
4.8/5 (36)
Table 26.3.1
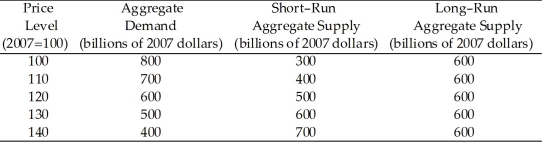 41)Refer to Table 26.3.1. Consider the economy represented in the table. In short-run macroeconomic equilibrium, the price level is ________ and the level of real GDP is ________ billion.
-Refer to Table 26.3.1. Consider the economy represented in the table. There is
41)Refer to Table 26.3.1. Consider the economy represented in the table. In short-run macroeconomic equilibrium, the price level is ________ and the level of real GDP is ________ billion.
-Refer to Table 26.3.1. Consider the economy represented in the table. There is
(Multiple Choice)
4.8/5 (30)
Figure 26.2.1
 -Refer to Figure 26.2.1. Which graph illustrates what happens when government expenditure increases?
(Multiple Choice)
4.9/5 (39)
Filters
- Essay(0)
- Multiple Choice(0)
- Short Answer(0)
- True False(0)
- Matching(0)