Exam 1: What Is Economics
Exam 1: What Is Economics212 Questions
Exam 2: The Economic Problem159 Questions
Exam 3: Demand and Supply198 Questions
Exam 4: Elasticity186 Questions
Exam 5: Efficiency and Equity121 Questions
Exam 6: Government Actions in Markets130 Questions
Exam 7: Global Markets in Action138 Questions
Exam 8: Utility and Demand120 Questions
Exam 9: Possibilities, Preferences, and Choices124 Questions
Exam 10: Organizing Production111 Questions
Exam 11: Output and Costs142 Questions
Exam 12: Perfect Competition117 Questions
Exam 13: Monopoly118 Questions
Exam 14: Monopolistic Competition122 Questions
Exam 15: Oligopoly106 Questions
Exam 16: Externalities116 Questions
Exam 17: Public Goods and Common Resources98 Questions
Exam 18: Markets for Factors of Production252 Questions
Select questions type
Use the figure below to answer the following questions.
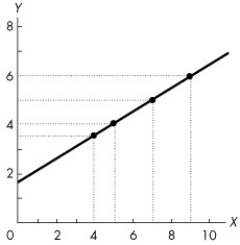 Figure 1A.2.1
-Refer to Figure 1A.2.1.If x decreases from 5 to 4, y
Figure 1A.2.1
-Refer to Figure 1A.2.1.If x decreases from 5 to 4, y
Free
(Multiple Choice)
4.7/5  (38)
(38)
Correct Answer: Verified
B
Two variables are negatively related if
Free
(Multiple Choice)
4.9/5 (44)
Correct Answer:Verified
A
Use the figure below to answer the following question.
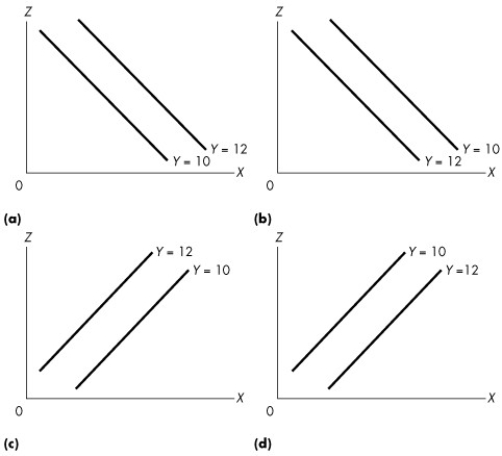 Figure 1A.4.2
-Given the data in the following table, which one of the graphs in Figure 1A.4.2 correctly represents the relationship among x, y, and z?
Figure 1A.4.2
-Given the data in the following table, which one of the graphs in Figure 1A.4.2 correctly represents the relationship among x, y, and z? 
Free
(Multiple Choice)
4.8/5 (35)
Correct Answer:Verified
C
When a firm decides to produce computers using robots instead of people, it is answering the ________ question.
(Multiple Choice)
4.9/5 (32)
Use the table below to answer the following questions.
Table 1A.4.2
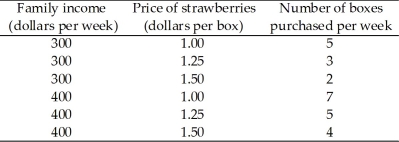 -Table 1A.4.2 shows that,
(Multiple Choice)
4.9/5 (38)
Use the figure below to answer the following question.
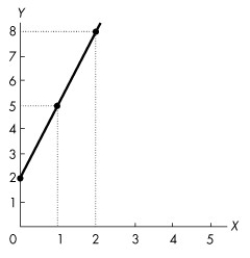 Figure 1A.5.2
-If the line in Figure 1A.5.2 were to continue down to the x-axis, what would the value of x be when y is zero?
Figure 1A.5.2
-If the line in Figure 1A.5.2 were to continue down to the x-axis, what would the value of x be when y is zero?
(Multiple Choice)
5.0/5 (39)
To disentangle cause and effect, economists use economic models and use ________ to test the predictions of those models.
(Multiple Choice)
4.9/5 (33)
Use the figure below to answer the following questions.
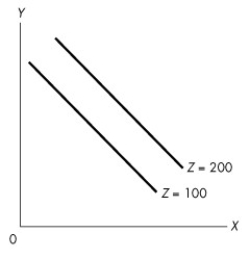 Figure 1A.4.3
-In Figure 1A.4.3, a decrease in the value of z results in, ceteris paribus,
Figure 1A.4.3
-In Figure 1A.4.3, a decrease in the value of z results in, ceteris paribus,
(Multiple Choice)
4.7/5 (42)
"The rich should face higher income tax rates than the poor." This is an example of
(Multiple Choice)
4.7/5 (34)
To earn income, people sell the services of the factors of production they own.Land earns ________and labour earns ________.
(Multiple Choice)
4.7/5 (30)
The study of how wages are set for New Brunswick teachers is classified as
(Multiple Choice)
4.9/5 (35)
Use the figure below to answer the following question.
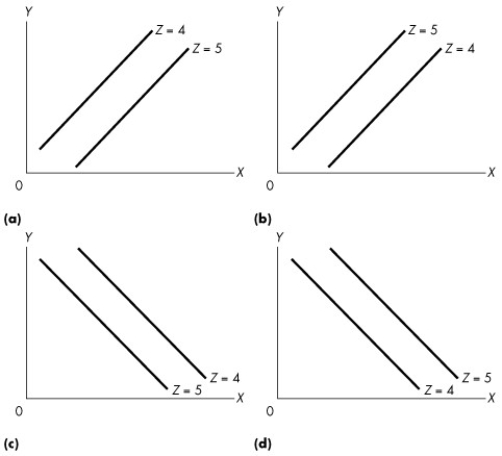 Figure 1A.4.1
-Given the data in the following table, which one of the graphs in Figure 1A.4.1 correctly represents the relationship among x, y, and z?
Figure 1A.4.1
-Given the data in the following table, which one of the graphs in Figure 1A.4.1 correctly represents the relationship among x, y, and z? 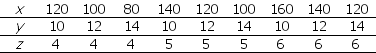
(Multiple Choice)
4.9/5 (41)
Use the figure below to answer the following questions.
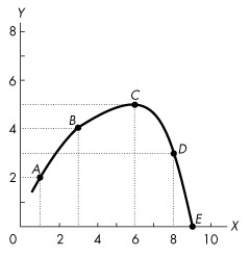 Figure 1A.3.5
-Refer to Figure 1A.3.5.In Figure 1A.3.5, the slope across arc CD is
Figure 1A.3.5
-Refer to Figure 1A.3.5.In Figure 1A.3.5, the slope across arc CD is
(Multiple Choice)
4.9/5 (36)
Use the table below to answer the following questions.
Table 1A.4.2
-Given the data in Table 1A.4.2, holding price constant, the graph of the purchases of strawberries, measured on the x-axis and family income, measured on the y-axis is a
(Multiple Choice)
4.8/5 (33)
Use the table below to answer the following question.
Table 1A.2.1
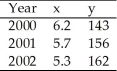 -The data in Table 1A.2.1 shows that
(Multiple Choice)
4.8/5 (41)
Filters
- Essay(0)
- Multiple Choice(0)
- Short Answer(0)
- True False(0)
- Matching(0)