Exam 26: Aggregate Supply and Aggregate Demand
Exam : 1 What Is Economics198 Questions
Exam 2: The Economic Problem143 Questions
Exam 3: Demand and Supply178 Questions
Exam 20: Measuring Gdp and Economic Growth127 Questions
Exam 21: Monitoring Jobs and Inflation112 Questions
Exam 22: Economic Growth90 Questions
Exam 23: Finance,saving,and Investment142 Questions
Exam 24: Money,the Price Level,and Inflation115 Questions
Exam 25: The Exchange Rate and the Balance of Payments114 Questions
Exam 26: Aggregate Supply and Aggregate Demand124 Questions
Exam 27: Expenditure Multipliers: the Keynesian Model158 Questions
Exam 28: Canadian Inflation,unemployment,and Business Cycle101 Questions
Exam 29: Fiscal Policy91 Questions
Exam 30: Monetary Policy88 Questions
Exam 15: International Trade Policy116 Questions
Select questions type
Use the figure below to answer the following questions.
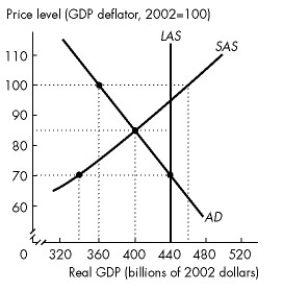 Figure 26.3.1
-Refer to Figure 26.3.1.Econoworld is at its short-run macroeconomic equilibrium.There is a difference between ________ real GDP and potential GDP of $________ billion.
Figure 26.3.1
-Refer to Figure 26.3.1.Econoworld is at its short-run macroeconomic equilibrium.There is a difference between ________ real GDP and potential GDP of $________ billion.
(Multiple Choice)
4.8/5  (38)
(38)
Use the figure below to answer the following questions.
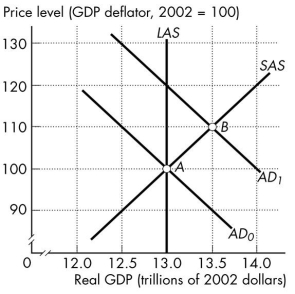 Figure 26.3.5
-Refer to Figure 26.3.5.The shift of the aggregate demand curve from AD0 to AD1 might have been the result of
Figure 26.3.5
-Refer to Figure 26.3.5.The shift of the aggregate demand curve from AD0 to AD1 might have been the result of
(Multiple Choice)
4.8/5 (34)
Everything else remaining the same,an increase in the quantity of money
(Multiple Choice)
4.8/5 (44)
Use the figure below to answer the following questions.
Figure 26.3.1
-Refer to Figure 26.3.1.Consider statements (1)and (2)and select the correct answer. (1) The economy of Econoworld is experiencing a below full-employment equilibrium.
(2) The actual unemployment rate equals the natural unemployment rate.
(Multiple Choice)
4.7/5 (45)
If a change in wealth is induced by a change in the price level,then this would be shown as a
(Multiple Choice)
4.9/5 (40)
Use the figure below to answer the following questions.
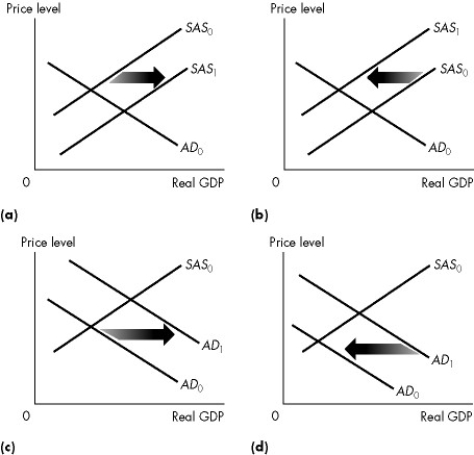 Figure 26.2.1
-Refer to Figure 26.2.1.Which graph illustrates what happens when government expenditure decreases?
Figure 26.2.1
-Refer to Figure 26.2.1.Which graph illustrates what happens when government expenditure decreases?
(Multiple Choice)
4.8/5 (27)
Use the figure below to answer the following questions.
Figure 26.3.1
-Refer to Figure 26.3.1.Consider statements (1)and (2)and select the correct answer. (1) The actual unemployment rate exceeds the natural unemployment rate.
(2) Short-run aggregate supply will automatically shift leftward as the economy adjusts to long-run equilibrium.
(Multiple Choice)
4.9/5 (39)
We observe an increase in the price level and an increase in real GDP.Which of the following is a possible explanation?
(Multiple Choice)
4.8/5 (38)
The short-run aggregate supply curve is the relationship between the quantity of real GDP supplied and
(Multiple Choice)
4.8/5 (40)
Use the table below to answer the following question.
Table 26.3.2
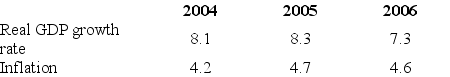 -Refer to Table 26.3.2.The International Monetary Fund's World Economic Outlook database provides the data given in the table for India in 2004,2005 and 2006. The numbers in the table are consistent with
(Multiple Choice)
4.9/5 (30)
Use the figure below to answer the following questions.
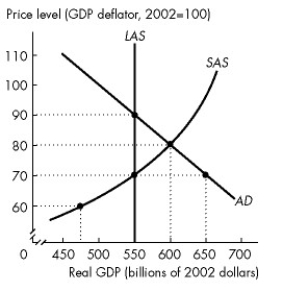 Figure 26.3.2
-Refer to Figure 26.3.2.Currently in Mythlo
Figure 26.3.2
-Refer to Figure 26.3.2.Currently in Mythlo
(Multiple Choice)
4.9/5 (44)
Everything else remaining the same,which one of the following increases aggregate demand?
(Multiple Choice)
4.7/5 (40)
Which one of the following newspaper quotations describes a shift of only the SAS curve?
(Multiple Choice)
4.9/5 (34)
Consider an economy starting from a position of full employment.Which one of the following changes does not occur as a result of a decrease in aggregate demand?
(Multiple Choice)
4.8/5 (39)
The quantity of real GDP demanded is composed of the purchases of
(Multiple Choice)
4.8/5 (38)
Use the figure below to answer the following questions.
Figure 26.2.1
-Refer to Figure 26.2.1.Which graph illustrates what happens when government expenditure increases?
(Multiple Choice)
4.9/5 (37)
Suppose there is an increase in the quantity of capital.As a result,the SAS
(Multiple Choice)
4.9/5 (40)
Which one of the following is a reason for the negative slope of the aggregate demand curve?
(Multiple Choice)
4.8/5 (41)
Filters
- Essay(0)
- Multiple Choice(0)
- Short Answer(0)
- True False(0)
- Matching(0)