Exam 3: Where Prices Come From: the Interaction of Demand and Supply
Exam 1: Economics: Foundations and Models145 Questions
Exam 2: Trade-Offs, comparative Advantage, and the Market System152 Questions
Exam 3: Where Prices Come From: the Interaction of Demand and Supply149 Questions
Exam 4: Economic Efficiency,government Price Setting,and Taxes137 Questions
Exam 5: The Economics of Health Care117 Questions
Exam 6: Firms, the Stock Market, and Corporate Governance140 Questions
Exam 7: Comparative Advantage and the Gains From International Trade124 Questions
Exam 8: Gdp: Measuring Total Production and Income135 Questions
Exam 9: Unemployment and Inflation148 Questions
Exam 10: Economic Growth, the Financial System, and Business Cycles130 Questions
Exam 11: Long-Run Economic Growth: Sources and Policies134 Questions
Exam 12: Aggregate Expenditure and Output in the Short Run157 Questions
Exam 13: Aggregate Demand and Aggregate Supply Analysis145 Questions
Exam 14: Money,banks,and the Federal Reserve System144 Questions
Exam 15: Monetary Policy145 Questions
Exam 16: Fiscal Policy155 Questions
Exam 17: Inflation, unemployment, and Federal Reserve Policy135 Questions
Exam 18: Macroeconomics in an Open Economy145 Questions
Exam 19: The International Financial System139 Questions
Select questions type
The demand for lobster is higher in the summer than in the spring.If the price of lobster is lower in summer than in spring then
(Multiple Choice)
4.9/5  (32)
(32)
Figure 3-6
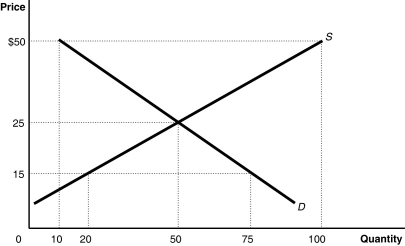 -Refer to Figure 3-6.The figure above represents the market for canvas tote bags.Assume that the market price is $35.Which of the following statement is true?
(Multiple Choice)
4.8/5 (26)
An increase in the number of firms in a market will cause the quantity of a good supplied to increase.
(True/False)
4.9/5 (39)
Figure 3-3
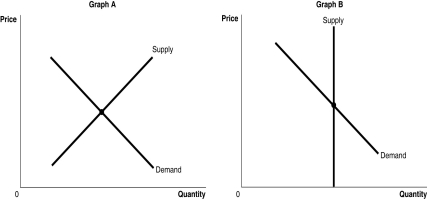 -Refer to Figure 3-3.The figure above shows the supply and demand curves for two markets: the market for original Picasso paintings and the market for designer jeans.Which graph most likely represents which market?
(Multiple Choice)
4.9/5 (34)
Table 3-1
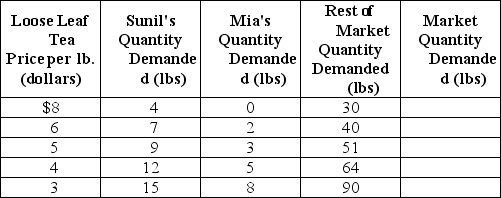 -Refer to Table 3-1.The table above shows the demand schedules for loose-leaf tea of two individuals (Sunil and Mia)and the rest of the market.If the price of loose-leaf tea rises from $3 to $4,the market quantity demanded would
(Multiple Choice)
4.9/5 (32)
If a firm has an incentive to increase supply now and decrease supply in the future,the firm expects that the
(Multiple Choice)
4.9/5 (39)
What is the difference between an "increase in demand" and an "increase in quantity demanded"?
(Multiple Choice)
4.9/5 (32)
If consumers believe the price of iPads will decrease in the future,this will cause the demand for iPads to decrease now.
(True/False)
4.8/5 (30)
Figure 3-7
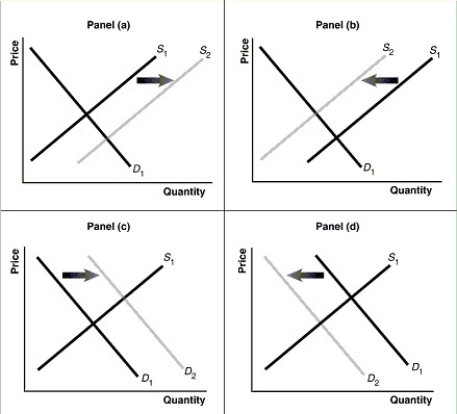 -Refer to Figure 3-7.Assume that the graphs in this figure represent the demand and supply curves for Fruitopia,a soft drink.Which panel describes what happens in the market for Fruitopia when the price of Snapple,a substitute product,decreases?
(Multiple Choice)
4.7/5 (36)
When the price of a good falls,consumers buy a larger quantity because of the ________ effect and the ________ effect.
(Multiple Choice)
4.7/5 (27)
Figure 3-8
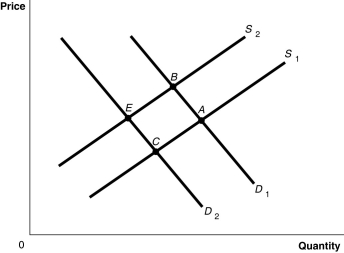 -Refer to Figure 3-8.The graph in this figure illustrates an initial competitive equilibrium in the market for apples at the intersection of D1 and S1 (point A) If there is an increase in the wages of apple workers and an increase in the price of oranges, a substitute for apples, the equilibrium could move to which point?
(Multiple Choice)
4.8/5 (28)
Which of the following is expected to occur as the baby-boom generation ages?
(Multiple Choice)
4.8/5 (41)
Figure 3-7
-Refer to Figure 3-7.Assume that the graphs in this figure represent the demand and supply curves for bicycle helmets.Which panel best describes what happens in this market if there is a substantial increase in the price of bicycles?
(Multiple Choice)
4.9/5 (42)
Figure 3-7
-Refer to Figure 3-7.Assume that the graphs in this figure represent the demand and supply curves for used clothing,an inferior good.Which panel describes what happens in this market as a result of a decrease in income?
(Multiple Choice)
4.9/5 (37)
A movement along the demand curve for toothpaste would be caused by
(Multiple Choice)
4.8/5 (35)
Technological advances have resulted in lower prices for digital cameras.What is the impact of this on the market for traditional (non-digital)cameras?
(Multiple Choice)
4.9/5 (43)
Buyers rush to purchase stocks in California vineyards following a forecast of a 30 percent decline in this year's grape harvest.What happens in the California wine market as a result of this announcement?
(Multiple Choice)
4.7/5 (36)
Filters
- Essay(0)
- Multiple Choice(0)
- Short Answer(0)
- True False(0)
- Matching(0)