Exam 4: Effective Charts
Exam 1: Navigate, manipulate, and Print Worksheets106 Questions
Exam 2: Formatting, functions, and Formulas100 Questions
Exam 3: Cell References, named Ranges, and Functions102 Questions
Exam 4: Effective Charts98 Questions
Exam 5: Complex Conditional and Retrieval Functions100 Questions
Exam 6: Analyze Data Using Tables100 Questions
Exam 7: Multiple Worksheets workbooks and Templates100 Questions
Exam 8: Refine an Excel Application100 Questions
Exam 9: Organize, import, export, and Cleanse Data Sets100 Questions
Exam 10: Data Tables, scenario Manager, and Solver101 Questions
Exam 11: Loan Amortization, investment Analysis, and Asset Depreciation100 Questions
Exam 12: Business Statistics and Regression Analysis103 Questions
Exam 13: Excels Data Model, Power-pivot, and Power View96 Questions
Exam 14: Visual Basic for Applications99 Questions
Exam 15: Appendix:efficient Interaction With a Touch Screen67 Questions
Exam 16: The Common Features of Microsoft Office81 Questions
Select questions type
To place an image into a chart,you click ________ in the Illustrations group on the INSERT tab.
(Multiple Choice)
4.7/5  (34)
(34)
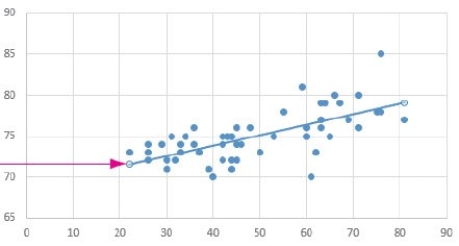 In the chart above,the line to which the red arrow is pointing,is called a(n)________.
(Short Answer)
4.7/5 (24)
To enter a footer or header to a worksheet,you click Header & Footer in the:
(Multiple Choice)
4.9/5 (32)
If you wanted to see how the value of Apple's stock has changed during the past year,you would use a ________ chart.
(Multiple Choice)
4.9/5 (34)
A(n)________ chart is useful for showing categories that change over time and where each column represents a unit of time.
(Multiple Choice)
4.8/5 (41)
By clicking the Chart Elements button,you can add,move,or remove data labels.
(True/False)
4.8/5 (35)
To create a pie chart,two data series,the labels and a set of corresponding values are required.
(True/False)
4.8/5 (36)
To show the relationship between two numeric variables,you would use a ________ chart.
(Multiple Choice)
4.9/5 (36)
To display the Format Data Labels task pane,you click the Data Labels ________ and select More Options.
(Short Answer)
4.7/5 (41)
A ________ chart is used to shows project schedule where each bar represents a project component or task.
(Multiple Choice)
4.7/5 (41)
Which of the following is NOT a chart background fill option?
(Multiple Choice)
4.8/5 (36)
By default,Excel displays both major gridlines and minor gridlines on a chart.
(True/False)
4.9/5 (37)
A common enhancement for a scatter chart is the addition of ________.
(Short Answer)
4.9/5 (40)
To modify the layout and data in an existing chart,you click Change Chart Type in the ________.
(Multiple Choice)
4.7/5 (45)
Filters
- Essay(0)
- Multiple Choice(0)
- Short Answer(0)
- True False(0)
- Matching(0)