Exam 4: Demand and Supply
Exam 1: Getting Started350 Questions
Exam 2: The Usand Global Economies199 Questions
Exam 3: The Economic Problem271 Questions
Exam 4: Demand and Supply317 Questions
Exam 5: Gdp: a Measure of Total Production and Income254 Questions
Exam 6: Jobs and Unemployment343 Questions
Exam 7: The Cpi and the Cost of Living265 Questions
Exam 8: Potential Gdp and the Natural Unemployment Rate207 Questions
Exam 9: Economic Growth267 Questions
Exam 10: Finance, Saving, and Investment269 Questions
Exam 11: The Monetary System361 Questions
Exam 12: Money, Interest, and Inflation261 Questions
Exam 13: Aggregate Supply and Aggregate Demand272 Questions
Exam 14: Aggregate Expenditure Multiplier311 Questions
Exam 15: The Short-Run Policy Tradeoff208 Questions
Exam 16: Fiscal Policy203 Questions
Exam 17: Monetary Policy188 Questions
Exam 18: International Trade Policy218 Questions
Exam 19: International Finance255 Questions
Select questions type
Quantity demanded (tons of cat food per year) Price (dollars per pound of cat food) Quantity supplied (tons of cat food per year) 52 1.00 15 46 1.50 26 43 2.00 34 40 2.50 40 35 3.00 44
-The above table gives the demand and supply schedules for cat food.If the price is $3.00 per pound of cat food, will there be a shortage, a surplus, or is this price the equilibrium price?
If there is a shortage, how much is the shortage?
If there is a surplus, how much is the surplus?
If $3.00 is the equilibrium price, what is the equilibrium quantity?
(Essay)
4.9/5  (44)
(44)
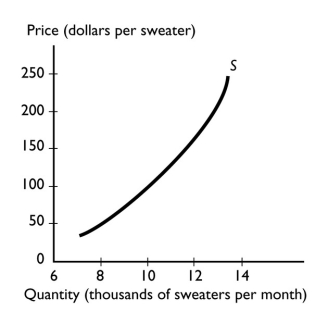 -The graph illustrates the supply of sweaters.Which of the following events will increase the supply of sweaters?
(Multiple Choice)
4.9/5 (34)
Consider the market for peanut butter.If there is an increase in the price of bread (a complement for peanut butter) along with a drought in peanut growing areas, the
(Multiple Choice)
4.7/5 (38)
In a recession, consumers have less income to spend. As a result, if dining out is a normal good, then which of the following would happen to the demand curve for dining out?
(Multiple Choice)
5.0/5 (49)
Price (dollars per latte) Quantity demanded (lattes per hour) 1 90 2 80 3 60 4 30
-The table above gives the demand schedule for lattes at the Bottomless Cup.If the price of a latte is $3, then the quantity of lattes demanded is ________ an hour.
(Multiple Choice)
4.9/5 (34)
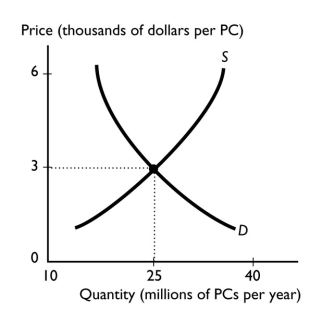 -The graph illustrates the market for computers.If the number of buyers of computers increases and technology advances, you predict that the
(Multiple Choice)
4.8/5 (41)
If both the supply and demand curves shift simultaneously, we can always predict what will happen to
(Multiple Choice)
4.9/5 (41)
Gasoline prices increase by 50 percent and other things remain the same.As a result, there is
(Multiple Choice)
4.9/5 (32)
Which of the following shifts the supply curve of popcorn leftward?
(Multiple Choice)
4.8/5 (40)
Quantity demanded (tons of cat food per year) Price (dollars per pound of cat food) Quantity supplied (tons of cat food per year) 52 1.00 15 46 1.50 26 43 2.00 34 40 2.50 40 35 3.00 44
-The above table gives the demand and supply schedules for cat food.What is the equilibrium price and quantity?
(Essay)
4.8/5 (37)
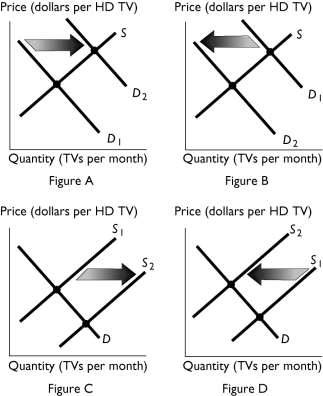 -The above figures show the market for HD televisions. If there are severe earthquakes that destroy a significant number of HD television manufacturing plants, which figure shows the effect of the earthquake?
(Multiple Choice)
4.9/5 (35)
People come to expect that the price of a gallon of gasoline will rise next week.As a result,
(Multiple Choice)
4.8/5 (37)
Soda and hot dogs are complements for one another.If a shortage of carbonated water leads to an increase in the price of soda, then the
(Multiple Choice)
4.8/5 (33)
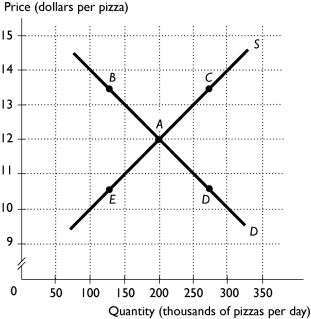 -The above figure shows the market for pizza.The market is in equilibrium when the wages paid pizza workers increases.What point represents the most likely new price and quantity?
(Multiple Choice)
4.7/5 (38)
Price (dollars per gallon) Quantity demanded (gallons of gasoline) Quantity supplied (gallons of gasoline 3.73 337,982 441,074 3.68 396,398 428,008 3.65 412,031 412,031 3.62 417,899 391,665
-The table above shows the situation in the gasoline market in Tulsa, Oklahoma.If the price of a gallon of gasoline is $3.73, then
(Multiple Choice)
4.9/5 (32)
Which of the following is the best explanation for why the price of gasoline increases during the summer months?
(Multiple Choice)
4.8/5 (33)
Consumers can use either natural gas or heating oil to warm their houses.Suppose the price of natural gas increases.Use a demand and supply diagram to show the impact of the higher price of natural gas on the market for home heating oil.
(Essay)
5.0/5 (38)
A rise in the price of a substitute in production for a good leads to
(Multiple Choice)
4.8/5 (29)
Mulch is shredded wood and is a by-product in the production of lumber.Because these two goods are produced together, they are
(Multiple Choice)
4.8/5 (39)
An increase in the number of producers of bird seed ________ the supply of bird seed and shifts the supply curve of bird seed ________.
(Multiple Choice)
4.9/5 (47)
Filters
- Essay(0)
- Multiple Choice(0)
- Short Answer(0)
- True False(0)
- Matching(0)